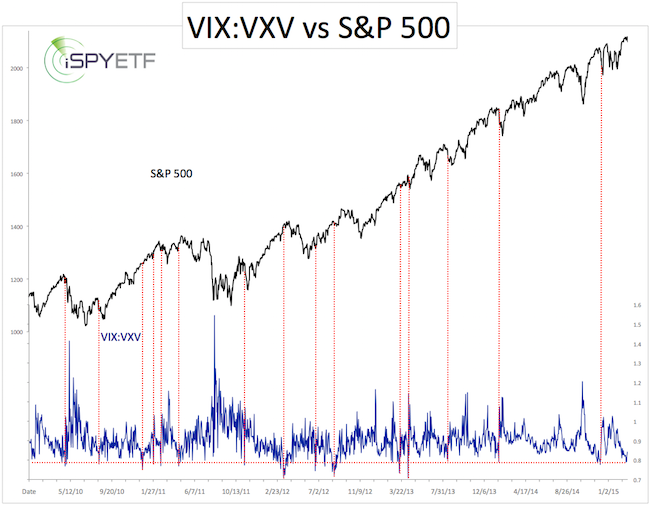
Investors are more concerned about implied 3-month S&P 500 volatility than 1-month volatility. How do we know that?
The ratio between the CBOE Volatility Index (VIX) and CBOE S&P 500 3-month Volatility Index (VXV) was just at 0.79, the lowest reading in 2015.
It is a sign of complacency when investors are more concerned about 3-month than 1-month volatility. Is it also a contrarian indicator?
The chart below plots the VIX:VXV ratio against the S&P 500 (NYSEArca: SPY). The dashed red lines mark all sub 0.80 readings since 2010. There were only four similar signals since the beginning of 2013. While not flat out wrong, the signals came either a bit too late or didn’t result in noteworthy weakness.

The VIX:VXV ratio is more valuable for bottom fishers than top pickers. Spikes above 1.1 have been more predictive of tradable lows than sub 0.8 readings of tradable tops.
Looking for more stock market analysis? >> Sign up for the FREE iSPYETF e-Newsletter
What about overall investor sentiment? Is overall investor sentiment worrisome? Here is a detailed look at six different investor sentiment gauges:
Should We be Worried about ‘Smart Money’ Leaving Stocks?
Simon Maierhofer is the publisher of the Profit Radar Report. The Profit Radar Report presents complex market analysis (S&P 500, Dow Jones, gold, silver, euro and bonds) in an easy format. Technical analysis, sentiment indicators, seasonal patterns and common sense are all wrapped up into two or more easy-to-read weekly updates. All Profit Radar Report recommendations resulted in a 59.51% net gain in 2013 and 17.59% in 2014.
Follow Simon on Twitter @ iSPYETF or sign up for the FREE iSPYETF Newsletter to get actionable ETF trade ideas delivered for free.

|