The U.S. economy is in a recession according to the self-pronounced authority on business cycles – the Economic Cycle Research Institute (ECRI).
The ECRI’s Weekly Leading Index (WLI) is worth writing about because it doesn’t solely focus on the same backward-looking indicators Wall Street relies on. The ECRI WLI includes more pertinent data like mortgage applications and money supply data.
So what’s the ECRI’s track record and its outlook?
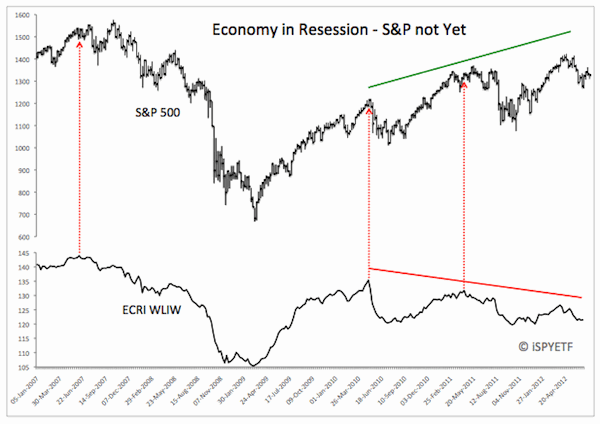
The chart below plots the S&P 500 against the ECRI WLIW (the second W stands for “weekly”).
The ECRI WLIW topped before the S&P 500 (SPY) and stocks in June 2007. ECRI’s November/December 2007 outlook stated that: “The growing weakness in the growth rates of ECRI’s leading indexes is a warning that recessionary weakness could develop.”
Not Wrong, But Not Right Either
That call wasn’t wrong, but it significantly understated the trouble that followed.
As the chart shows, the April 2010 top coincided with the market’s top tick. The May 2011 top in the ECRI WLIW occurred before the market top, although the market should not have reached another recovery high according to the ECRI WLIW.

One thing the index illustrates nicely is the consistent deterioration of economic fundamentals versus rising stock prices.
ECRI’s last major announcement was that “U.S. leading indexes may be pointing to an approaching economic slowdown” (taken from its April 2011 U.S. Cyclical Outlook). That slowdown came … and went … and may be back again now. At a recent interview, ECRI's co-founder Lakshman Achutan, stated that he expects a fairly minor 1990s like recession.
In summary, I would say that the ECRI WLIW is one of the better measures of economic activity, but it lacks the accuracy needed to consider it an indicator used to make buy/sell decisions.
One of my upcoming articles will feature a killer chart showing why the S&P 500 has been moving up even though the economic activity is clearly slowing.
|