Apple shares (Nasdaq: AAPL) have been flying below the radar. AAPL is moseying around near all-time highs without making a big splash.
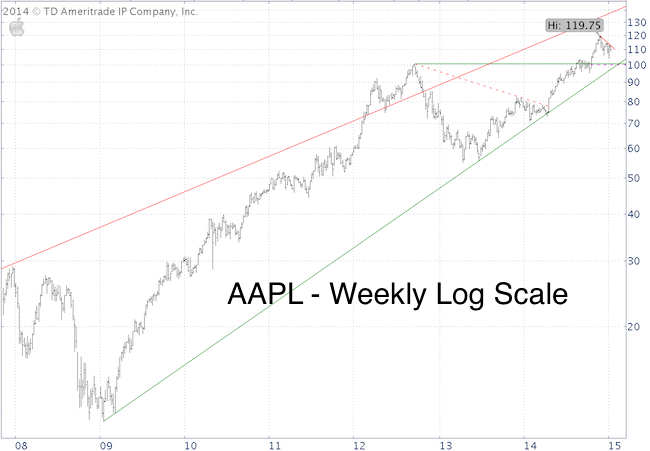
The weekly AAPL log scale has the potential to stir up this sea of tranquility.

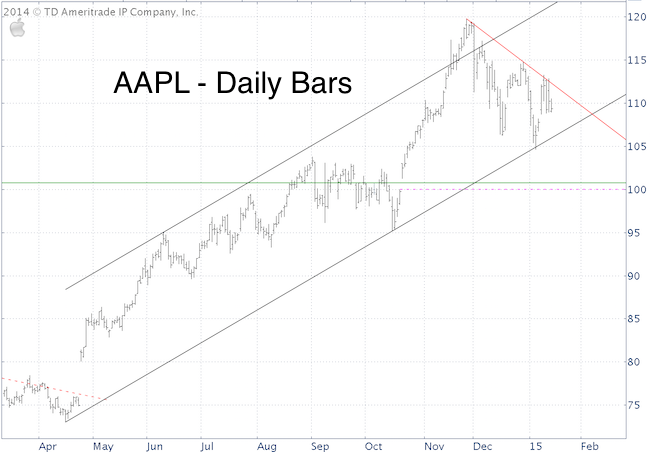
There is strong support around 100. A look at the daily chart shows an open chart gap at 99.96.
Complex Analysis Made Easy - Sign Up for the FREE iSPYETF E-Newsletter
Chart gaps often act as magnets, and the allure of the gap combined with strong support could cause a 10% correction.
The daily (non-log) chart also shows trend channel support around 106.

The short red line has served as resistance and may continue to do so.
Near-term support is around 106, but failure to hold 106 should lead to 100, which may be a good buying opportunity.
Simon Maierhofer is the publisher of the Profit Radar Report. The Profit Radar Report presents complex market analysis (S&P 500, Dow Jones, gold, silver, euro and bonds) in an easy format. Technical analysis, sentiment indicators, seasonal patterns and common sense are all wrapped up into two or more easy-to-read weekly updates. All Profit Radar Report recommendations resulted in a 59.51% net gain in 2013.
Follow Simon on Twitter @ iSPYETF or sign up for the FREE iSPYETF Newsletter to get actionable ETF trade ideas delivered for free.

|