As far as Wall Street is concerned, this may well be the most exciting week of the year.
Wide S&P 500 swings have stretched the 5-day trading range (ATR) to the second highest of the year. All this is happening against a backdrop of imploding oil prices, a Russian ruble crash and cratering junk bonds.
And, by the way, volatility (NYSEArca: VXX) is up too.
Short-term Market Conflict
The market is trading heavy and seems to want to continue lower. However, bullish seasonality may hold back the correction like a leash holds back a wondering dog.
This week is triple witching Friday. Since the CME introduced S&P 500 futures in 1997, the futures finished triple witching week higher 96.8% of the time.
Longer-term Market Conflict
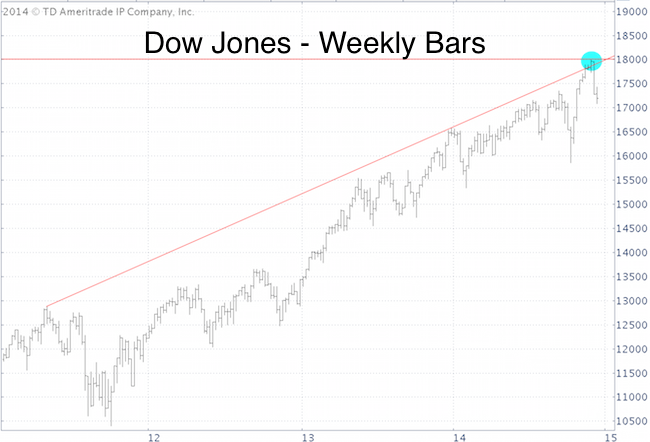
In early December, the Dow Jones (NYSEAra: DIA) reached a significant inflection point. The December 7 Profit Radar Report warned that: “The Dow Jones nearly tagged resistance at 18,004, increasing the chances of a temporary pullback.”
The chart below, initially featured in the December 7 Profit Radar Report, offers a visual of two long term resistance levels:
-
Trend line resistance going back to May 2011
-
Fibonacci projection resistance going back to 2002
Despite the cantankerous drop from the December 5 highs, the stock market did not display the classic signs of a major market top prior to the reversal.
What is a ‘classic sign of a major market top’? It’s a bearish non-confirmation by an indicator I call ‘secret sauce.’
There is a minor 6-day bearish divergence between the S&P 500 (NYSEArca: SPY) and secret sauce, but prior market tops were preceded by months, not days of divergences (more details here).
These conflicts caution that the market is in somewhat of a ‘black hole.’ More down side is possible, but the final top doesn’t appear to be in yet. The Russell 2000 (NYSEArca: IWM) may be the canary in the mine, as it find support exactly where it should have. As a simple rule of thumb, only a drop below yesterday's low will unlock significantly lower price targets.
There’s a fair amount of uncertainty, and all that on FOMC day.
Simon Maierhofer is the publisher of the Profit Radar Report. The Profit Radar Report presents complex market analysis (S&P 500, Dow Jones, gold, silver, euro and bonds) in an easy format. Technical analysis, sentiment indicators, seasonal patterns and common sense are all wrapped up into two or more easy-to-read weekly updates. All Profit Radar Report recommendations resulted in a 59.51% net gain in 2013.
Follow Simon on Twitter @ iSPYETF to get actionable ETF trade ideas delivered for free.

|
