Social media stocks have been taking it on the chin this week: Facebook – down, LinkedIn – down, Twitter – down.
The Global X Social Media Index ETF (NYSEArca: SOCL) reflects this sad performance.
The Social Media ETF chart shows SOCL slicing below it’s 200 and 20-day SMA and the green support line.
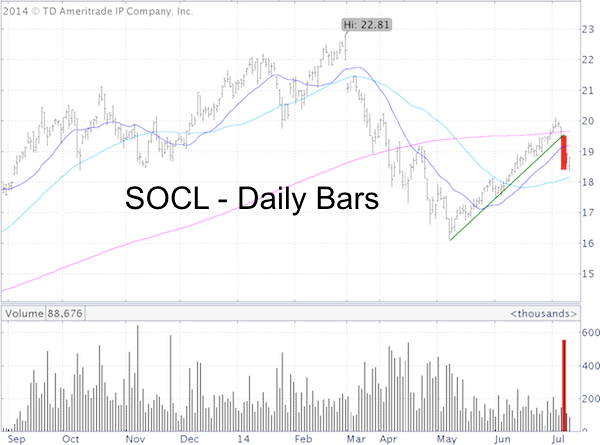
Perhaps more importantly, Tuesday’s decline came on almost 5x average trading volume.
With a 20% rally from May to July, social media has been a leading S&P 500 sub-sector.
What does this social media sell off mean for the S&P 500 (SNP: ^GSPC)?
The chart below plots SOCL against the S&P 500 and highlights periods of SOCL weakness.
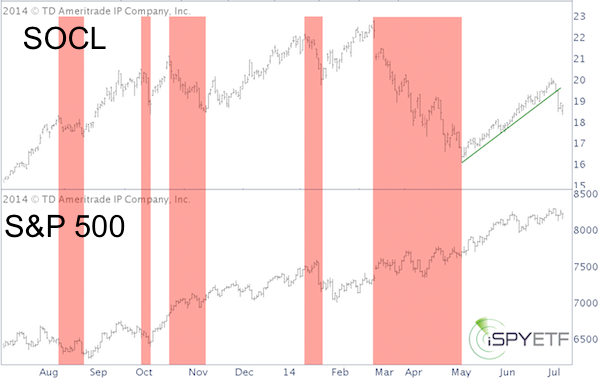
A 28% March/April SOCL drop didn’t affect the S&P 500, in fact the S&P recorded modest gains.
Summary
A leading sector losing steam is not the best scenario, but recent history shows that SOCL weakness in itself doesn’t have to take down the S&P 500 (NYSEArca: SPY).
There are other factors that may take down the S&P and market in general, but we don't even have to worry about those, as long as the S&P stays above a very specific support level. More details here:
S&P 500 Short-Term Forecast – Key Support Level
Simon Maierhofer is the publisher of the Profit Radar Report. The Profit Radar Report presents complex market analysis (S&P 500, Dow Jones, gold, silver, euro and bonds) in an easy format. Technical analysis, sentiment indicators, seasonal patterns and common sense are all wrapped up into two or more easy-to-read weekly updates. All Profit Radar Report recommendations resulted in a 59.51% net gain in 2013.
Follow Simon on Twitter @ iSPYETF or sign up for the FREE iSPYETF Newsletter to get actionable ETF trade ideas delivered for free.

|
