The 2000 and 2007 market crashes, and even the 2010 and 2011 corrections were preceded by excessive investor optimism.
Well, once bitten, twice shy. Investors are trying their darndest not to make the same mistake again. Nobody wants to get left holding the bag … again.
That’s why investor sentiment indicators are more closely monitored and written up today than at any other time (at least it feels that way).
How optimistic or pessimistic are investors right now?
Frankly, it depends on who you ask.
If you ask investment advisors and newsletter writers (as Investors Intelligence - II - does every week), you’ll get bullish forecasts from 60.2%.
If you ask retail investors (as the American Association for Individual Investors - AAII - does every week), you find that only 37.20% of ‘average Joe’ investors are bullish.
This is unusual. How unusual?
The chart below plots the S&P 500 against the percentage of bullish advisors (II), the percentage of bullish investors (AAII) and the difference between the two (II - AAII).
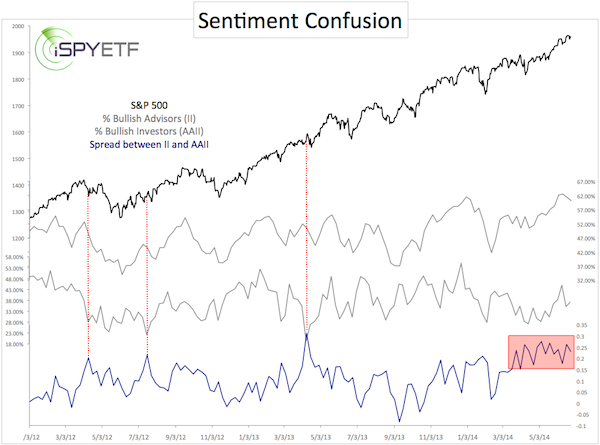
We saw a similar discrepancy between retail investors and advisors in April 2014, but the current spell of differing opinions is the longest stretch since at least the 2007 market top.
Prior instances since 2012 led to smaller pullbacks followed by continued gains.
However, the sample size is too small to draw any high probability conclusions.
Here are two additional factors worth considering:
-
Overall investor sentiment (a composite of six different sentiment indicators) is at or near a bullish extreme (today's Sentiment Picture - published by the Profit Radar Report - contains a detailed look at six different sentiment gauges).
-
The S&P 500 is struggling to move above major resistance around 1,955. In fact, this resistance is so significant that the 2014 S&P 500 Forecast (published by the Profit Radar Report) projected a May/June high at 1,955 on January 15, 2014.
We have yet to see sustained trade above 1,955. Obviously, the market considers this resistance cluster important.
What are the odds of the S&P 500 reversing here? Could this be a major market top?
More details are available here: Updated 2014 S&P 500 Forecast
Simon Maierhofer is the publisher of the Profit Radar Report. The Profit Radar Report presents complex market analysis (S&P 500, Dow Jones, gold, silver, euro and bonds) in an easy format. Technical analysis, sentiment indicators, seasonal patterns and common sense are all wrapped up into two or more easy-to-read weekly updates. All Profit Radar Report recommendations resulted in a 59.51% net gain in 2013.
Follow Simon on Twitter @ iSPYETF or sign up for the FREE iSPYETF Newsletter to get actionable ETF trade ideas delivered for free.

|
