Along with the Dow Jones and S&P 500, more than 500 individual stocks recorded new 52-week highs last week.
However, like the Dow and S&P, most stocks weren’t able to hold on to their lofty price tags.
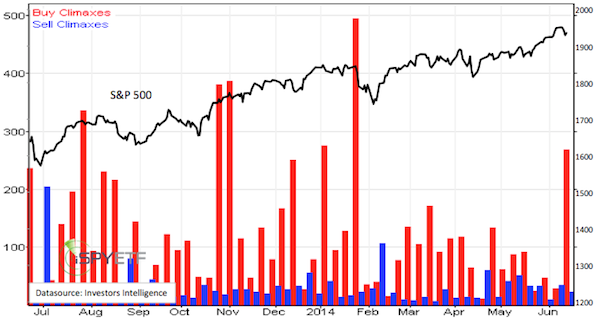
12% of S&P 500 (SNP: ^GSPC) stocks had buying climaxes. This is the highest reading since January 27, and the second highest reading of the year.
A buying climax takes place when a stock makes a 52-week high, but closes the week with a loss.
According to Investors Intelligence, which tracks buying/selling climaxes, buying climaxes are a sign of distribution and indicate that stocks are moving from strong hands to weak ones.
The chart below, which plots buying/selling climaxes against the S&P 500 (NYSEArca: SPY), harmonizes with the assessment of Investors Intelligence.

An increased amount of buying climaxes often results in a flattening of the up trend or price weakness.
However, none of the buying climax spikes in recent years has resulted in a major market top (even though many pundits have been calling for just such a major top).
What does this cluster of buying climaxes mean for stocks?
Here’s a detailed S&P 500 forecast based on the three key forces that drive the market.
Updates 2014 S&P 500 Forecast
Simon Maierhofer is the publisher of the Profit Radar Report. The Profit Radar Report presents complex market analysis (S&P 500, Dow Jones, gold, silver, euro and bonds) in an easy format. Technical analysis, sentiment indicators, seasonal patterns and common sense are all wrapped up into two or more easy-to-read weekly updates. All Profit Radar Report recommendations resulted in a 59.51% net gain in 2013.
Follow Simon on Twitter @ iSPYETF or sign up for the FREE iSPYETF Newsletter to get actionable ETF trade ideas delivered for free.

|