On May 13, I wrote about a brand-new (at least to me) correlation that can be used as a forward-looking indicator. At the time, it suggested a sharp S&P 500 spike (original article here: “Fed Fund Rate Suggests S&P 500 Rally").
The strong S&P 500 (SNP: ^GSPC) rally obviously boosts this particular indicator’s track record, so let's take a look at its latest message.
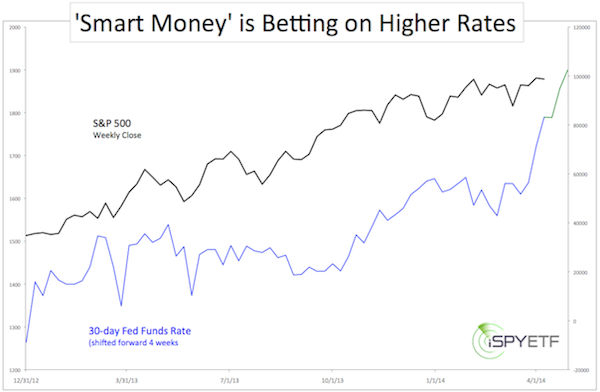
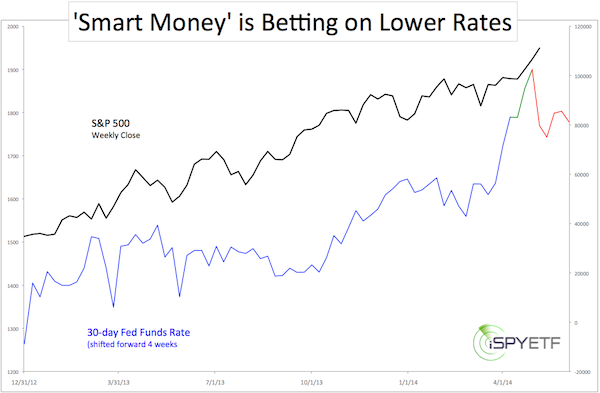
The correlation we’re talking about is between the S&P 500 and the 30-day Federal funds rate.
The Fed funds rate is the rate that banks charge each other for overnight loans to meet their reserve balance requirements. The Fed funds rate is in essence the ‘father of all interest rates,’ as it acts as the base rate for all other U.S. interest rates.
With a couple of tweaks the stale Fed funds rate can be turned into a forward-looking indicator. Here are the tweaks:
-
We look at 30-day Federal Funds Rate sentiment provided by the commitment of traders (COT) report. We are mainly interested in the net positions of commercial traders (considered the ‘smart money’).
-
We shift the COT sentiment data forward by 30 days (approximately four weeks, since the COT report is released weekly).
Figure 1 is the original chart published in my May 13 article, which plots the S&P 500 against net fund rate futures by commercial traders (the green line projected the S&P’s implied trajectory).

Figure 2 is the same chart just updated. It includes the most recent COT Fed funds rate sentiment data since May 9 (red line).

There generally is a direct correlation between Treasury rates and stock prices. That’s why the correlation (when set forward 4 weeks) works quite often.
The recent drop in commercial traders’ fed fund rate futures suggests weakness ahead for the S&P 500 (NYSEArca: SPY).
When I first looked at this correlation in early May, it confirmed my personal sentiment analysis, but contradicted the media’s bearish outlook. In fact, the media was so bearish, it had to be bullish for stocks.
Via the May 11 Profit Radar Report I proposed that: “Our carefully crafted 2014 outlook (which called for a May/June correction) has become the crowded trade. The chart detective inside of me favors a pop to 1,915. Historic price patterns suggest a breakout to the up side with the possibility of an extended move higher.”
The S&P 500 broke above 1,915 and has now hit another major 'bump in the road' (resistance level), that's why it hasn't gone anywhere for several days.
Will this resistance level turn back stocks? This question is analyzed in a detailed bigger picture outlook for the S&P 500:
An Updated 2014 S&P 500 Outlook
Simon Maierhofer is the publisher of the Profit Radar Report. The Profit Radar Report presents complex market analysis (S&P 500, Dow Jones, gold, silver, euro and bonds) in an easy format. Technical analysis, sentiment indicators, seasonal patterns and common sense are all wrapped up into two or more easy-to-read weekly updates. All Profit Radar Report recommendations resulted in a 59.51% net gain in 2013.
Follow Simon on Twitter @ iSPYETF or sign up for the FREE iSPYETF Newsletter to get actionable ETF trade ideas delivered for free.

|