I spend a fair amount of money on market data, research and interpretation. Not because I have too much time, but it takes a ton of information from different sources to form an educated and objective opinion.
At least two of the newsletters I subscribe to continue to refer to ‘extreme investor bullishness’ and extreme risk for Dow Jones (NYSEArca: DIA), S&P, etc.
Investor sentiment is one of the key components of my market forecasting formula. I track various sentiment measures consistently, but aside from ‘bullish pockets’ here and there, I just don’t currently see extreme bullishness.
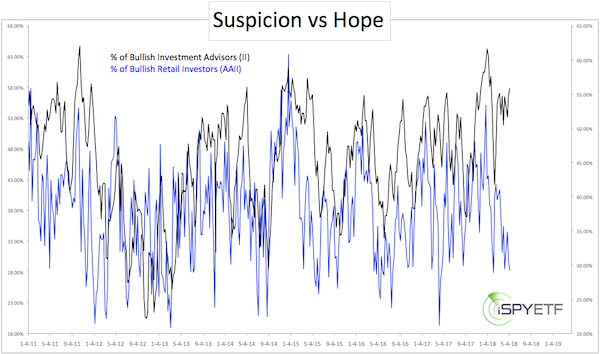
Quite contrary to extreme optimism, there is a huge difference in opinion between investment advisors and newsletter-writing colleagues polled by Investors Intelligence (II) and the retail investor crowd polled by the American Association of Individual Investors (AAII).

55.8% of investment advisors are bullish, an outlook shared by only 28.3% of retail investors. This is one of the biggest opinion gaps in recent years.
Which of the two – investment advisors (II) or retail investors (AAII) – is usually right?
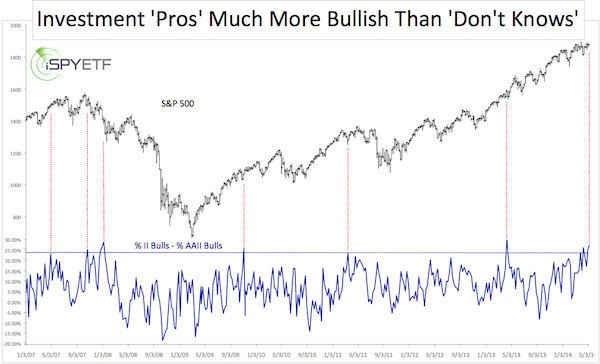
The chart below plots the S&P 500 (NYSEArca: SPY) against the difference between II bulls and AAII bulls (formula: % of II bulls - % of AAII bulls).

The dotted red lines highlight when the difference was greater than 23%.
This happened six prior times since 2007. Aside from the January 2008 occurrence, the S&P 500 was higher one week later every time. One month later the S&P 500 (NYSEArca: SPY) traded higher four out of six times.
It looks like when there’s a significant difference of opinion, investment advisors have a small edge over retail investors, but the one time retail investors were right (2008), it really paid off.
Could the current disparity foreshadow another major 'event' (meaning crash)? Here's a look at three insightful factors:
3 Reasons Why to Expect the May Blues ... But Not Yet?
Simon Maierhofer is the publisher of the Profit Radar Report. The Profit Radar Report presents complex market analysis (S&P 500, Dow Jones, gold, silver, euro and bonds) in an easy format. Technical analysis, sentiment indicators, seasonal patterns and common sense are all wrapped up into two or more easy-to-read weekly updates. All Profit Radar Report recommendations resulted in a 59.51% net gain in 2013.
Follow Simon on Twitter @ iSPYETF or sign up for the FREE iSPYETF Newsletter to get actionable ETF trade ideas delivered for free.

|