Small cap stocks have been taking it on the chin. The Russell 2000 lost as much as 9.85%. How bad is small caps’ performance relative to large caps?
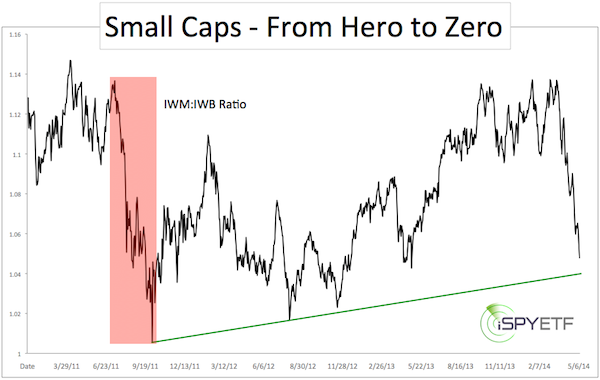
Bad! Here’s a look at the small cap:large cap ratio (published in yesterday’s Profit Radar Report). The chart below shows the ratio between the iShares Russell 2000 ETF (NYSEArca: IWM) and the iShares Russell 1000 ETF (NYSEArca: IWB).

Small caps erased an 11-month performance edge in less than 6 weeks. The last time the IWM:IWB dropped as far was from July – October 2011.
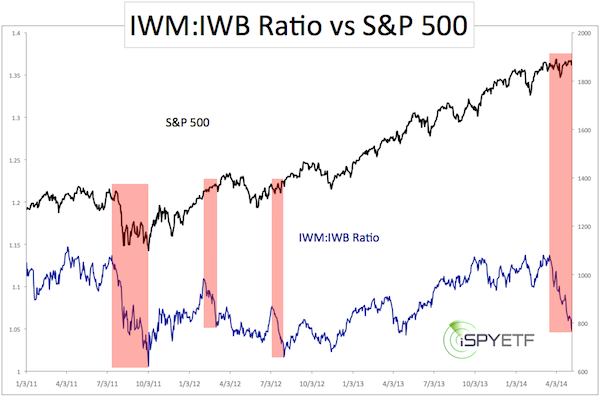
The second chart plots the S&P 500 (SNP: ^GSPC) against the IWM:IWB ratio. The July – October 2011 small cap underperformance (big IWM:IWB drop) was a coordinated decline that saw large and small caps decline at the same time.

Small caps just fell much harder than the S&P 500.
This time is different. Small caps are down significantly while large caps (S&P 500 and Dow Jones) remain within 1.5% of their all-time highs.
At the same time, the Russell 2000 closed below the 200-day SMA for the first time since November 21, 2012.
However, this may be more of a bear trap than a sell signal. There is a must hold support area that’s more important (because not as obvious) and less prone to false signals than the 200-day SMA.
Must hold support is outlined in yesterday’s Profit Radar Report.
Personally, I feel that there’s been too much bearish media coverage for stocks to enter an immediate, prolonged correction (must hold support will tell me when I’m wrong), so I’m also looking at key resistance. The kind of resistance that should U-turn a bounce.
Must hold support is discussed in yesterday’s Profit Radar Report. Key resistance is revealed here:
The Secret Dow Jones Barrier Every Investor Should Know
Simon Maierhofer is the publisher of the Profit Radar Report. The Profit Radar Report presents complex market analysis (S&P 500, Dow Jones, gold, silver, euro and bonds) in an easy format. Technical analysis, sentiment indicators, seasonal patterns and common sense are all wrapped up into two or more easy-to-read weekly updates. All Profit Radar Report recommendations resulted in a 59.51% net gain in 2013.
Follow Simon on Twitter @ iSPYETF or sign up for the FREE iSPYETF Newsletter to get actionable ETF trade ideas delivered for free.

|