The economy added 288,000 jobs, driving the unemployment rate to 6.3% (lowest reading since September 2008).
That’s great, but simple odds suggest a tough week ahead for the S&P 500 (SNP: ^GSPC).
What are those ‘simple odds’?
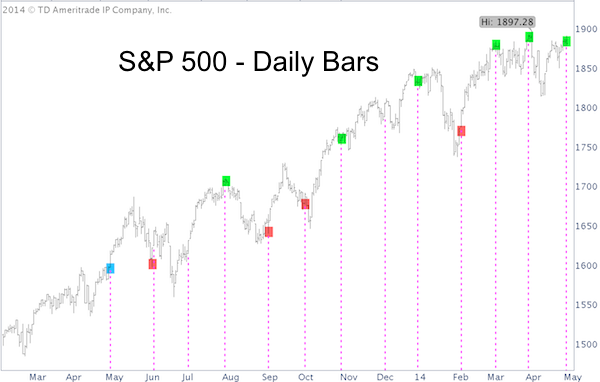
The S&P 500 chart below highlights the days when the BLS released the unemployment report (going back to May 2013).

The jobless numbers (regardless of good, bad or ugly) tend to affect the S&P 500 in one of two ways:
-
Lift S&P when in a small down trend (red boxes)
-
Depress S&P when near a 52-week high (green boxes)
Jobless figures reported when the S&P 500 (NYSEArca: SPY) is near its 52-week high, such as today, have generally led to weakness thereafter.
There’s one exception: The S&P 500 was near its 52-week (and all-time) high when jobless figures were released May 2013, and continued to plow higher (at least for another two weeks).
Perhaps too many investors jumped on the ‘sell in May and go away’ bandwagon in 2013. The ‘May pop’ was the market’s way of fooling the crowd.
Will 2014 be similar? No, not necessarily in terms in performance, but yes in terms of the market fooling the crowd. Currently too many investors are expecting the same thing. Here’s why (and how) the stock market will most likely throw investors a ‘curveball.’
Expecting ‘Sell in May and Go Away’ Pattern? Prepare for Surprise
Simon Maierhofer is the publisher of the Profit Radar Report. The Profit Radar Report presents complex market analysis (S&P 500, Dow Jones, gold, silver, euro and bonds) in an easy format. Technical analysis, sentiment indicators, seasonal patterns and common sense are all wrapped up into two or more easy-to-read weekly updates. All Profit Radar Report recommendations resulted in a 59.51% net gain in 2013.
Follow Simon on Twitter @ iSPYETF or sign up for the FREE iSPYETF Newsletter to get actionable ETF trade ideas delivered for free.

|