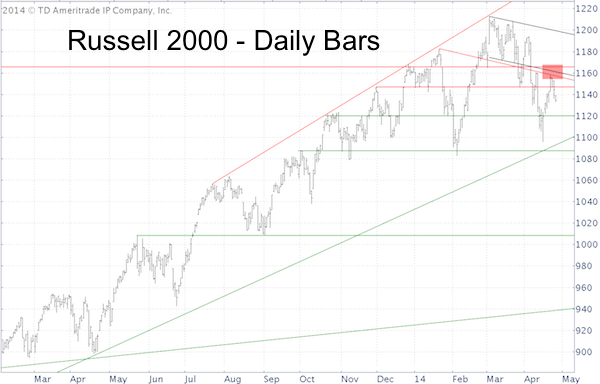
On Thursday the Nasdaq-100 (Nasdaq: QQQ) was up 0.96%, the S&P 500 (NYSEArca: SPY) 0.17%. But the Russell 2000 (NYSEArca: IWM) was down 0.24%.
What’s the common denominator of this fragmented performance?
Apple! AAPL soared 8.20%.
AAPL accounts for 11.78% of the Nasdaq-100, 2.80% of the S&P 500, and zero of the Russell 2000. Thursday was Apple-day. The more Apple, the better.
How would the broader market have fared without Apple’s boost?
One way to find out is to look at the equal weighted Nasdaq-100 ETF (QQEW), which was down 0.01%.
Another way to find out is to look at the Russell 2000, although representing a different market segment (small caps), which is totally Apple free.

The Russell 2000 was rejected by resistance cluster at 1,147, 1,160 and 1,165.
The performance of lesser or non-Apple exposed indexes cautions that the broad market is weaker than it appears.
In fact, the Nasdaq chart shows an immense amount of potentially bearish energy. More details here:
Did the Nasdaq Just Start a Prolonged Head-and Shoulders Decline?
Simon Maierhofer is the publisher of the Profit Radar Report. The Profit Radar Report presents complex market analysis (S&P 500, Dow Jones, gold, silver, euro and bonds) in an easy format. Technical analysis, sentiment indicators, seasonal patterns and common sense are all wrapped up into two or more easy-to-read weekly updates. All Profit Radar Report recommendations resulted in a 59.51% net gain in 2013.
Follow Simon on Twitter @ iSPYETF or sign up for the FREE iSPYETF Newsletter to get actionable ETF trade ideas delivered for free.

|