Somebody flipped the switch from ‘risk on’ to ‘risk off.’
There are many measures of ‘risk on – risk off.’ Almost all of them are lagging.
I usually don’t care for lagging gauges, but this one has an interesting twist.
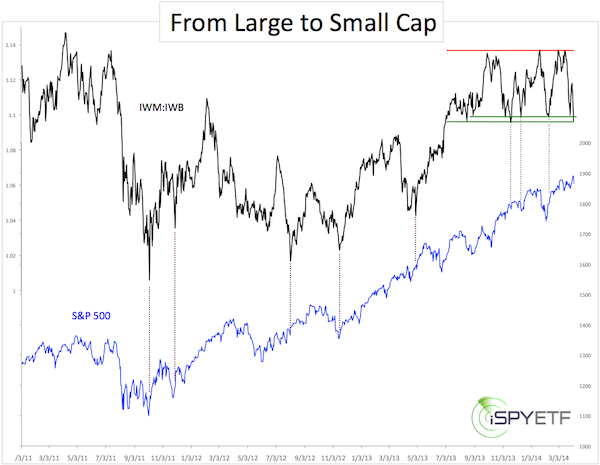
Illustrated in the chart below is the ratio between the iShares Russell 2000 ETF (NYSEArca: IWM) and iShares Russell 1000 ETF (NYSEArca: IWB).

A high ratio means that investors prefer small caps over large caps (risk on) and vice versa.
Although the ratio has been stuck in a range since August 2013, up until recently more money was flowing into the small cap Russell 2000 ETF than into the large cap Russell 1000 ETF.
This changed rather abruptly.
Here’s what makes this IWM:IWB ratio interesting:
The ratio has dropped to levels of prior support. As the dashed purple lines indicate, ratio lows generally occur fairly close to S&P 500 lows.
Obviously, the IWM:IWB is not at a new low, but the gray lines show that prior tests of this low caused temporary S&P 500 (NYSE: SPY) bounces.
This may be the case here too. A drop below the lower green support line, however, may indicate a change of investor behavior.
Less appetite for risk generally translates into lower prices.
While the IWM:IWB ratio has yet to drop below support, another indicator has already triggered a sell signal. More details here:'
MACD Triggers the Year's Most Infamous Sell Signal
Simon Maierhofer is the publisher of the Profit Radar Report. The Profit Radar Report presents complex market analysis (S&P 500, Dow Jones, gold, silver, euro and bonds) in an easy format. Technical analysis, sentiment indicators, seasonal patterns and common sense are all wrapped up into two or more easy-to-read weekly updates. All Profit Radar Report recommendations resulted in a 59.51% net gain in 2013.
Follow Simon on Twitter @ iSPYETF or sign up for the FREE iSPYETF Newsletter to get actionable ETF trade ideas delivered for free.

|