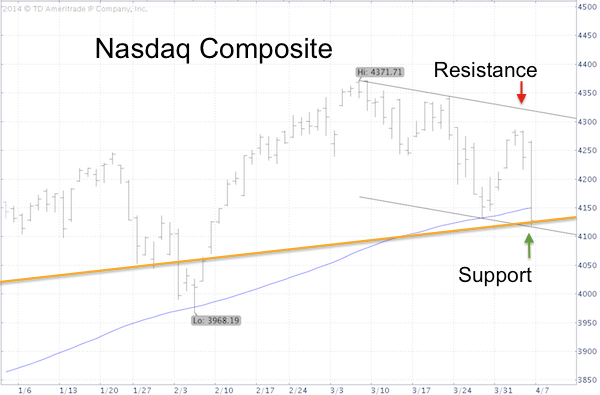
Today the Nasdaq Composite (Nasdaq: ^IXIC) lost 2.6% and closed below the 100-day moving average for the first time since December 31, 2012.
Is that bearish for the overall market?
The Nasdaq Indexes (Composite and Nasdaq-100) have been lagging the S&P quite significantly for a few weeks.
Purely statistical, the recent spread between the S&P and Nasdaq is quite rare and does not consistently foreshadow trouble ahead.
However, it does reveak that investors are developing a degree of risk aversion not seen in all of 2013.
The April 2 Profit Radar Report featured this chart of the Nasdaq-100 and cautioned that a move above resistance was needed, otherwise this week’s S&P 500 break out would turn into a fake out.

By today’s close the Nasdaq arrived at the bottom of the short-term trend channel and at the top of a long-term trend channel (I’ll write about this long-term channel in detail next week).
If the Nasdaq is going to bounce (at least short-term), it should do so around the current convergence of trend channels. Further weakness will caution of more down side.
Do trend channels actually work?
Many investors don’t think so (and make their opinion known in the comments section below), but the facts (= market action) show that simple channels do work.
Earlier this week I published an article featuring two S&P 500 charts that clearly show trend channel resistance at 1,900 (today’s high was 1,897) along with channel support.
Being aware of such simple tools is like gaining legal insider knowledge (disclosure: some investors prefer to call technical analysis ‘chicken poop’).
Regardless of your opinion, the two charts highlighting key support and resistance are available here: S&P 500 Stuck Between Triple Top and Triple Bottom
Simon Maierhofer is the publisher of the Profit Radar Report. The Profit Radar Report presents complex market analysis (S&P 500, Dow Jones, gold, silver, euro and bonds) in an easy format. Technical analysis, sentiment indicators, seasonal patterns and common sense are all wrapped up into two or more easy-to-read weekly updates. All Profit Radar Report recommendations resulted in a 59.51% net gain in 2013.
Follow Simon on Twitter @ iSPYETF or sign up for the FREE iSPYETF Newsletter to get actionable ETF trade ideas delivered for free.

|