We’ve identified a few key support levels for various indexes last week, such as 1,840 for the S&P 500 (NYSEArca: SPY) and 1,150 for the Russell 2000.
Here’s another one for one of the hottest sectors on Wall Street: Biotechnology.
The ripping performance of Biotech has strongly contributed to the Nasdaq’s 2013 gains … and the recent Nasdaq (Nasdaq: QQQ) losses.
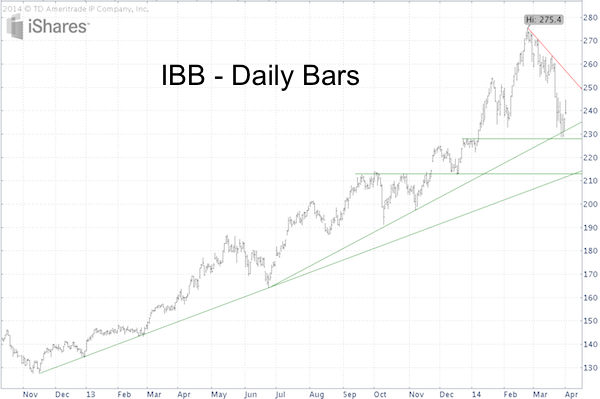
The Nasdaq Biotechnology Index (Nasdaq: IBB) chart below shows important short-term support around 228. This support is made up of an ascending trend line and prior December high.

Additional support is around 213.
Like many other indexes, Biotech has stair-stepped higher, creating many potential support levels, but 288 seems to be important to the short-term.
A break below 228 should minimally lead to 213.
On the other hand, the rally continues to live as long as IBB can stay above 228. Next resistance is around 250.
Fascination is also the technical picture for the S&P 500, which is stuck between triple bottom and triple top. Which way will the S&P break? A detailed (very detailed) analysis is available here:
S&P 500 - Stuck Between Triple Bottom and Triple Top - What's Next?
Simon Maierhofer is the publisher of the Profit Radar Report. The Profit Radar Report presents complex market analysis (S&P 500, Dow Jones, gold, silver, euro and bonds) in an easy format. Technical analysis, sentiment indicators, seasonal patterns and common sense are all wrapped up into two or more easy-to-read weekly updates. All Profit Radar Report recommendations resulted in a 59.51% net gain in 2013.
Follow Simon on Twitter @ iSPYETF or sign up for the FREE iSPYETF Newsletter to get actionable ETF trade ideas delivered for free.

|