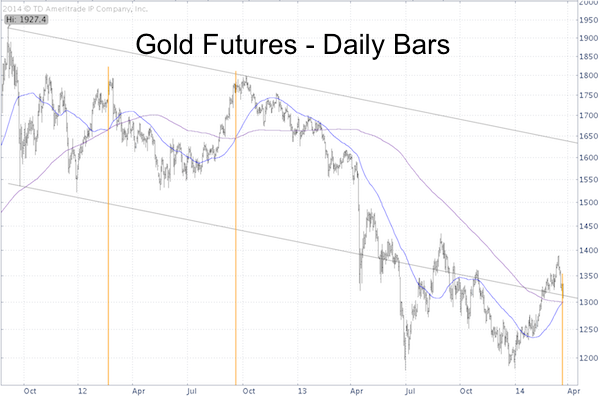
On Friday Gold’s 50-day simple moving average (SMA) crossed above the 200-day SMA.
This is called the ‘Golden Cross’ and by many considered a bullish signal.
To illustrate the folly of following conventional wisdom, consider the following: In late 2012 the S&P 500 (SNP: ^GSPC) was on the verge of seeing a 50-month/200-month bearish ‘Death Cross.’ This didn’t pan out.
And as the chart below shows, buying gold based on the bullish SMA crossover wouldn’t be such a good idea.

The yellow time lines mark the last two ‘bullish’ crossovers. Buying at the crossover basically meant buying at the top. Please note that gold futures and the SPDR Gold Shares (NYSEArca: GLD) did not quite trigger a ‘Golden Cross’ in February 2012 (gold cash prices did).
The results improve a little bit if we expand the time frame to include the last 34 years.
The ‘Golden Cross’ did capture some nice rallies (particularly in 1976 and 2009), but the median returns 1, 3 and 12 months after the 50/200-day SMA crossover were positive less than 50% of the time.
What’s unique about this particular golden cross is that the 50 and 200-day SMA merge to provide support at 1,300, not far below current trade.
The bigger question, however, is whether the rally from gold’s low is the beginning of a new bull market or a bull trap.
This article features a definite assessment (make sure to look at the date):
Gold Rally – New Bull Market or Bull Trap?
Simon Maierhofer is the publisher of the Profit Radar Report. The Profit Radar Report presents complex market analysis (S&P 500, Dow Jones, gold, silver, euro and bonds) in an easy format. Technical analysis, sentiment indicators, seasonal patterns and common sense are all wrapped up into two or more easy-to-read weekly updates. All Profit Radar Report recommendations resulted in a 59.51% net gain in 2013.
Follow Simon on Twitter @ iSPYETF or sign up for the FREE iSPYETF Newsletter to get actionable ETF trade ideas delivered for free.

|