Once every quarter stock index futures, stock index options, and stock options all expire on the same day.
This is called ‘Triple Witching,’ which is today.
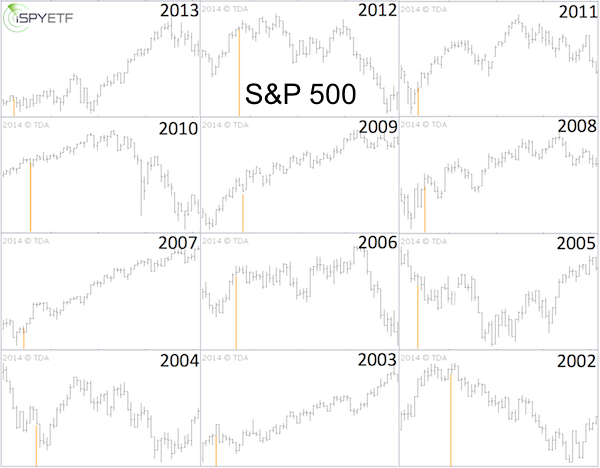
March Triple Witching brings a rather bearish current.
Since the SPDR S&P 500 ETF (NYSEArca: SPY) began trading in 1993, the S&P 500 closed lower on Triple Witching day 15 out of 21 years (71%).
The week after Triple Witching Friday ended with a weekly S&P 500 loss 14 out of 21 years (66%).

The chart above shows the performance of the S&P 500 (SNP: ^GSPC) following Triple Witching for the last 12 years.
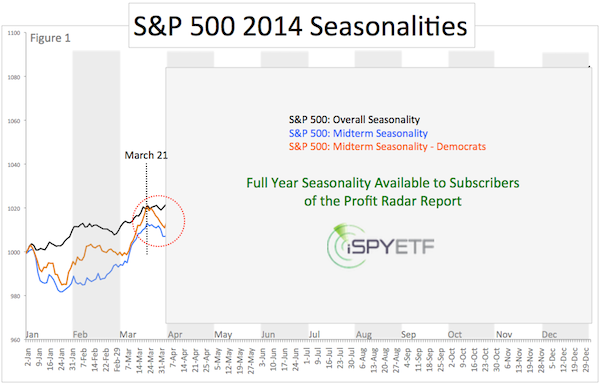
Post-expiration day weakness is also reflected in the S&P 500 seasonality chart going all the way back to 1950.

The seasonality chart shows:
-
Overall S&P 500 seasonality (based on every year since 1950)
-
Midterm S&P 500 seasonality (based on every midterm year since 1950)
-
Midterm S&P 500 seasonality with democratic president
Based on the Triple Witching and long-term seasonal patterns, the S&P 500 is likely to run into some trouble in late March (full 2014 seasonal chart is available to subscribers of the Profit Radar Report)
From a technical analysis point of view, there are specific levels that will unlock higher or lower targets.
One resistance level, that - once broken - could act as trigger level is discussed here:
Is it Too Late to Jump into Stocks? Watch How the S&P 500 Reacts to This Inflection Point
Simon Maierhofer is the publisher of the Profit Radar Report. The Profit Radar Report presents complex market analysis (S&P 500, Dow Jones, gold, silver, euro and bonds) in an easy format. Technical analysis, sentiment indicators, seasonal patterns and common sense are all wrapped up into two or more easy-to-read weekly updates. All Profit Radar Report recommendations resulted in a 59.51% net gain in 2013.
Follow Simon on Twitter @ iSPYETF or sign up for the FREE iSPYETF Newsletter to get actionable ETF trade ideas delivered for free.

|