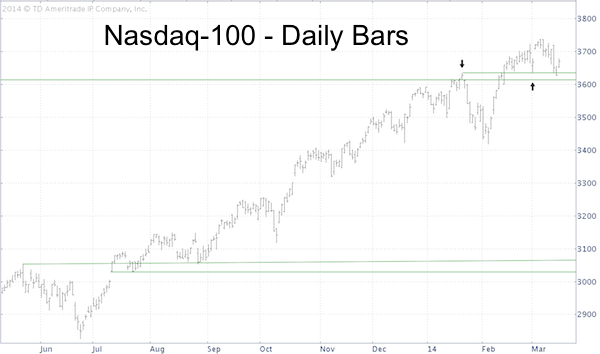
On Friday I tweeted a picture of an important technical support shelf for the Nasdaq-100.
Here’s a closer look at important near-term support for the Nasdaq Composite, Nasdaq-100, and Nasdaq QQQ ETF (Nasdaq: QQQ).
Nasdaq-100 Support
The chart shows support around the January 22 high (which is also the March 3 low) and the October 2000 monthly candle high (lower green line).

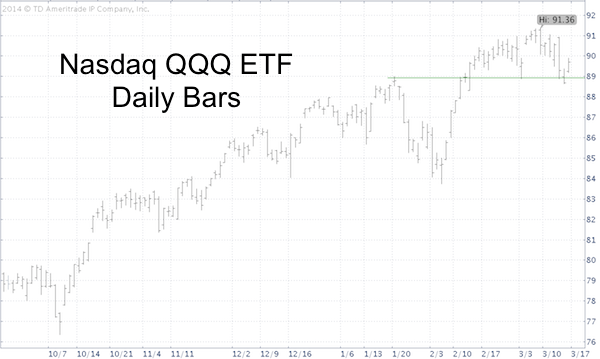
Nasdaq QQQ ETF
Technical support for the Nasdaq QQQ ETF is around 88.90.

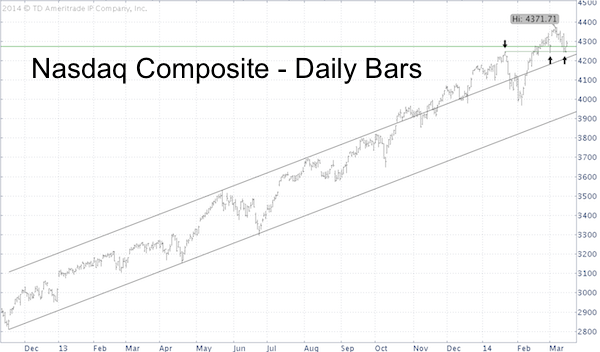
Nasdaq Composite
The Nasdaq Composite (Nasdaq: ^IXIC) found support exactly at the January 22 high (which is also the March 3 low).
The 78.6% Fibonacci retracement of all points lost from 2000 to 2002 is at 4,271.

Rising trend channel support is at 4,222 and the 50-day SMA at 4,207.
We don’t draw those support levels, the market does (we just connect the dots).
In addition to the subtle Nasdaq clues, there’s been one ‘tip off indicator’ that’s kept investors on the right side of the trade, and it’s not one often talked about:
Leading Indicator: What the Yen Carry Trade Predicts for Stocks
Simon Maierhofer is the publisher of the Profit Radar Report. The Profit Radar Report presents complex market analysis (S&P 500, Dow Jones, gold, silver, euro and bonds) in an easy format. Technical analysis, sentiment indicators, seasonal patterns and common sense are all wrapped up into two or more easy-to-read weekly updates. All Profit Radar Report recommendations resulted in a 59.51% net gain in 2013.
Follow Simon on Twitter @ iSPYETF or sign up for the FREE iSPYETF Newsletter to get actionable ETF trade ideas delivered for free.

|