The media is obsessed with data, and the monthly unemployment report is the ‘Big Kahuna’ of economic data.
However, from an investment point of view, there is as good as no benefit to the unemployment figures. Investing based on those figures (and the media’s spin) may actually be harmful. Here are three reasons why?
1) We don’t know in advance what the final figure is going to be.
For example, yesterday CNBC reported “Wall Street sets the bar low for Friday’s jobs report,” while Reuters warned that “Mood cautious before U.S. jobs data.”
The actual report released today was better than expected. The economy added 175,000 new jobs last month and the January numbers were revised up from 113,000 to 129,000.
Obviously the post report headline is much different than the above pre report headlines:
Reuters: “S&P 500 ends at another record after strong jobs data.” Oh the beauty of hindsight.
2) Even if we knew the unemployment numbers before they are released, there’s no rhyme and reason to how stocks react.
Today unemployment figures were surprisingly good, but the S&P 500 (SNP: ^GSPC) didn’t go anywhere.
How many times were good numbers greeted by bad short-term performance and vice versa. Good news tends to trigger pullbacks more consistently than bad news.
If more jobs were created and stocks are up, it’s because the economy is improving.
If fewer jobs were created and stocks are up, it’s because there’s more reason for QE.
Interesting factoid: The SPDR S&P 500 ETF (NYSEArca: SPY) was up 15 of the last 16 times on the day the BLS released the unemployment figures (regardless of the data).
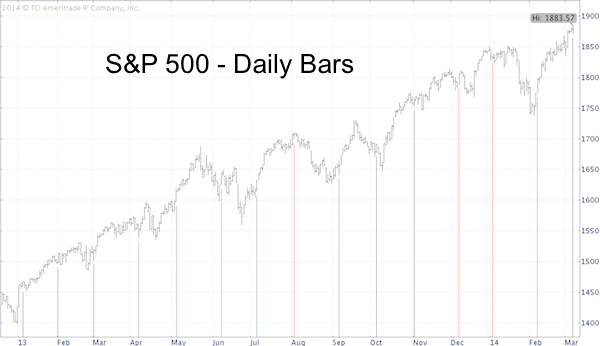
The S&P 500 chart below marks all the unemployment release dates and shows that the S&P 500 didn’t always follow through on the positive initial reaction, which brings us to the next point.

3) According to SentimenTrader, when the S&P 500 hit a 52-week high on a payroll report day, the next day was up only 36% (regardless of the data).
So what should we expect from Friday’s data?
Reuters: “Stocks may extend rally after strong jobs data.”
You can bet your money on it … or you can look at another piece of (more reliable) information.
Even a quick glance at a slightly annotated chart shows that the S&P 500 is at an inflection point that may accelerate this rally or send shares lower.
Here’s the S&P 500 chart with more details:
Is it Too Late to Jump into Stocks? Watch S&P Reaction to this Inflection Point
Simon Maierhofer is the publisher of the Profit Radar Report. The Profit Radar Report presents complex market analysis (S&P 500, Dow Jones, gold, silver, euro and bonds) in an easy format. Technical analysis, sentiment indicators, seasonal patterns and common sense are all wrapped up into two or more easy-to-read weekly updates. All Profit Radar Report recommendations resulted in a 59.51% net gain in 2013.
Follow Simon on Twitter @ iSPYETF or sign up for the FREE iSPYETF Newsletter to get actionable ETF trade ideas delivered for free.

|