This is a big potential pothole for any investor looking to buy or sell the euro, dollar or EUR/USD.
This article will look at the EUR/USD (CCY: EUR/USD) pair, which reflects how many U.S. dollars are needed to purchase one euro.
There is no ETF that tracks the currency pair (as EUR/USD does), but here are four basic dollar and euro ETFs:
CurrencyShares Euro Trust (NYSEArca: FXE)
UltraShort Euro ProShares (NYSEArca: EUO)
PowerShares DB US Dollar Bullish ETF (NYSEArca: UUP)
PowerShares DB US Dollar Bearish ETF (NYSEArca: UDN)
The analysis of the EUR/USD currency pair will affect all of the four ETFs (FXE, EUO, UUP, UDN) and protect against getting stuck on the wrong side of the trade.
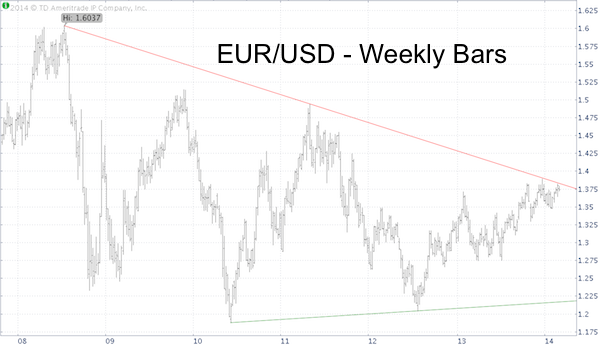
The EUR/USD chart shows an ever-narrowing trading range. Using two basic trend lines we can outline the upper and the lower trading boundary.

The EUR/USD touched the upper boundary three times and continues to trade near this resistance trend line.
The simple approach is to be bearish as long as trade remains below the trend line and get bullish if it rallies above.
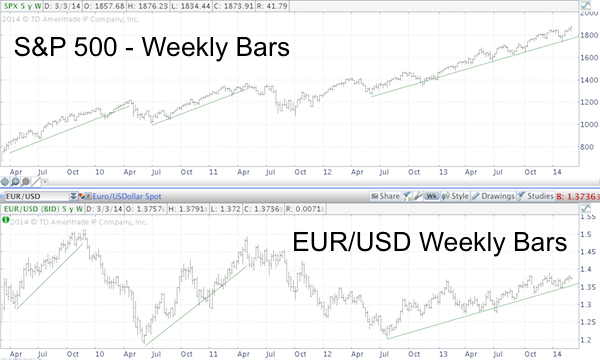
This chart is not just significant for currencies only, it is also of interest to stock investors.

The chart above plots the S&P 500 against the EUR/USD pair. Although the correlation is not perfect, a rising euro and EUR/USD is generally positive for the S&P 500 (SNP: ^GSPC).
So what's next for the S&P 500? Here's a detailed short-term analysis for the S&P 500: A Revised Short-term S&P 500 Outlook
Simon Maierhofer is the publisher of the Profit Radar Report. The Profit Radar Report presents complex market analysis (S&P 500, Dow Jones, gold, silver, euro and bonds) in an easy format. Technical analysis, sentiment indicators, seasonal patterns and common sense are all wrapped up into two or more easy-to-read weekly updates. All Profit Radar Report recommendations resulted in a 59.51% net gain in 2013.
Follow Simon on Twitter @ iSPYETF or sign up for the FREE iSPYETF Newsletter to get actionable ETF trade ideas delivered for free.

|