I’ve read a couple of articles recently commenting on the stock market’s ‘bad breadth.’ In particular referring to the S&P 500 (NYSEArca: SPY) and Nasdaq.
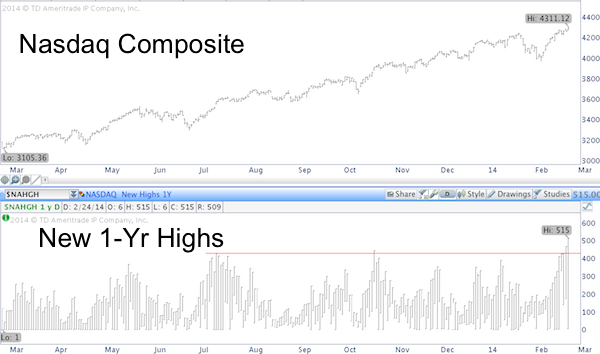
One stock market forecasting service claimed on Friday that only 5.27% of Nasdaq Composite (Nasdaq: ^IXIC) stocks trade at 52-week highs and that the Nasdaq is poised to roll over.
Contrary to this claim, the chart below – which plots the Nasdaq Composite against the number of individual Nasdaq Composite component highs - shows that the number of stocks at new 52-week highs is at a one-year high.

Another market forecasting service referenced ‘bad S&P 500 and Nasdaq breadth’ on February 11 and cautioned that: “A majority of stocks are nearing downtrends and a larger selloff.”
The Nasdaq (Nasdaq: QQQ) has tagged on another 5% since than, and you may not be surprised to hear that the above observations come from ‘perma-bear’ forecasting services.
Nevertheless, it is true that the percentage of Nasdaq and S&P 500 (even NYSE) constituents above their 20, 50 or 200-day SMA’s is lagging.
But such kinds of breadth divergences are a blunt timing tool. In fact, the percentage of S&P 500 and Nasdaq stocks above their 50-day SMA peaked in January 2013 (at 93.4% for the S&P 500 and 80.29% for the Nasdaq).
The February 2 Profit Radar Report addressed such divergences and highlighted the three stages of a ‘dying’ bull market:
“Dead man walking” is an expression used by prison guards as the condemned were led to their execution.
Are we looking at a ‘dead bull walking?’ The post-2009 QE bull market is nearly five years old. The average bull market lasts about 3 ½ years. In terms of longevity, this bull market is on borrowed time. What about other factors?
Bearish Divergences: The 3 Stages of A ‘Dying’ Bull Market
-
Psychological process: Finding value becomes a challenge and investors become pickier. Technical manifestation: The number of stocks hitting new 52-week highs or the percentage of stocks above the 50-day SMA slides lower, while prices climb higher.”
-
Stages 2 and 3 are available to subscribers of the Profit Radar Report.
Based particularly on sentiment and technical divergences, the December 20 Profit Radar Report warned that: "Bullish sentiment will catch up with stocks in January," but because there weren't enough bearish divergences indicative of a major top the update continued: "This should cause a deeper, but only temporary correction."
No doubt the bull market is aging, but ordering the coffin right now appears premature.
This doesn’t mean that stocks won’t pull back. An upcoming pullback is quite likely.
More importantly, the interpretation of the above data shows that objectivity is a key ingredient to a market forecaster’s success. Investing with blinders and looking for data that supports any particular bias tends to end in tears.
In the spirit of 'looking at both sides of the story,' here are two thought-provoking articles:
New Spin on an Old Indicator Gives Big Fat Buy Signal
Indicator: Risk of 'Black Swan' Event is Elevated
Simon Maierhofer is the publisher of the Profit Radar Report. The Profit Radar Report presents complex market analysis (S&P 500, Dow Jones, gold, silver, euro and bonds) in an easy format. Technical analysis, sentiment indicators, seasonal patterns and common sense are all wrapped up into two or more easy-to-read weekly updates. All Profit Radar Report recommendations resulted in a 59.51% net gain in 2013.
Follow Simon on Twitter @ iSPYETF or sign up for the FREE iSPYETF Newsletter to get actionable ETF trade ideas delivered for free.

|