There are leading indicators and there are lagging indicators.
Leading indicators (are supposed to) predict turns before they occur. Lagging indicators confirm a turn after it occurred.
It was a combination of leading indicators that prompted this forecast in the February 3, 5 Profit Radar Report: “There was a bullish RSI divergence. Selling pressure is subsiding. The potential for a roaring rally exists.”
The S&P 500 (SNP: ^GSPC) has overshot 1,830; the ideal up side target outlined by the February 9 Profit Radar Report.
Despite the strong rally, one lagging indicator has not yet confirmed the S&P’s up trend. MACD.
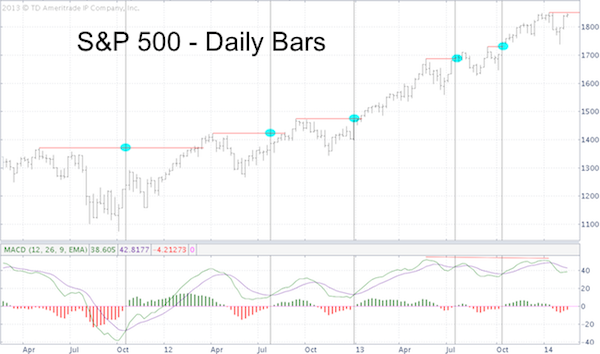
The chart below plots the S&P 500 against weekly MACD.

The green line is still well below the purple line as the histogram shows.
MACD is a momentum indicator so a delayed reaction is normal, however prior up trends were confirmed quicker than the current one.
The vertical black lines mark bullish MACD crossovers. The horizontal red lines mark the high prior to the correction.
The blue dots illustrate that the MACD generally turned positive before the S&P 500 (NYSEArca: SPY) surpassed its prior highs.
This isn’t the case this time around. Although the S&P 500 has come within four points of its prior high, MACD continues to lag.
It’s always difficult to extrapolate meaningful forward looking guidance from a backward looking indicator, but MACD suggests the rally may not (yet?) be as strong as it needs to be to break out.
In addition, we note that MACD at the S&P’s January high stayed below the MACD reading at the May S&P high. This is another potentially bearish divergence.
If you’ve read my recent articles, you notice that there are enough bearish indicators to paint a bearish picture (I.e. 3 Bearish Indicators Buck the Avanlance of Bullish Signals) and enough bullish indicators to paint a bullish one (I.e. New Spin on an Old Indictor Gives Big Fat Buy Signal) .
Am I playing both sides of the market? No. But it is important to be aware of all the facts and make an educated decision.
Sometimes the most obvious path is the right path. So far, the S&P 500 has followed the Profit Radar Reports proposed outlook (rally from the 1,730s to the 1,830s) so it deserves the benefit of doubt until proven wrong.
If you read the articles above, you'll see that there is a clear level of ruin for this outlook and one specific outcome that will prove it correct. Here are more details: The Last Hope for Bears
Simon Maierhofer is the publisher of the Profit Radar Report. The Profit Radar Report presents complex market analysis (S&P 500, Dow Jones, gold, silver, euro and bonds) in an easy format. Technical analysis, sentiment indicators, seasonal patterns and common sense are all wrapped up into two or more easy-to-read weekly updates. All Profit Radar Report recommendations resulted in a 59.51% net gain in 2013.
Follow Simon on Twitter @ iSPYETF or sign up for the FREE iSPYETF Newsletter to get actionable ETF trade ideas delivered for free.

|