Professional money managers spend tons of time and money on investment research, so you’d expect them to stick to whatever decision they make.
But that’s not the case. Data from the National Association of Active Investment Managers (NAAIM) suggests that even the pros fold quickly.
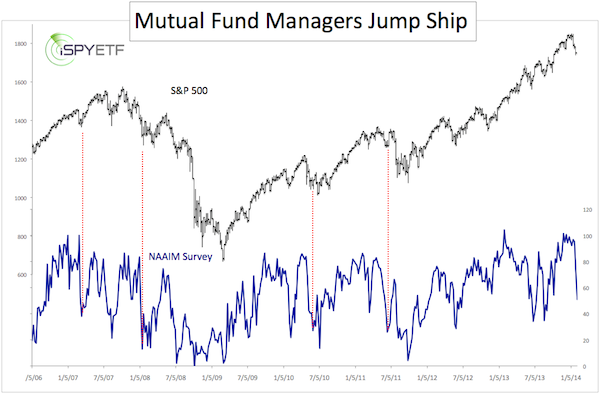
The chart below plots the S&P 500 (SNP: ^GSPC) against the average stock exposure of investment managers polled by NAAIM.

With exposure of 101% the average manager was actually leveraged long in November and December and still 96% long in January.
Since November, managers have slashed their allocation to stocks by 49.75% to a current exposure of 50.97%.
Such quick reversals from similarly bullish readings don’t happen too often. The red lines in the chart above show some of them and how the S&P 500 performed thereafter.
The sample size is small, but three out of four times saw a short-term rebound, followed by more weakness and an eventual recovery for the S&P 500 (NYSEArca: SPY).
I find this mildly fascinating, because this harmonizes with the message produced by my composite of indicators.
Although, it appears like the eventual recovery could become the biggest sucker rally in a long time, at least that’s the message of two monster stock market cycles that converge for one massive sell signal in 2014.
More details can be found here:
2 Monster Stock Market Cycles Project Major S&P 500 Top in 2014
Simon Maierhofer is the publisher of the Profit Radar Report. The Profit Radar Report presents complex market analysis (S&P 500, Dow Jones, gold, silver, euro and bonds) in an easy format. Technical analysis, sentiment indicators, seasonal patterns and common sense are all wrapped up into two or more easy-to-read weekly updates. All Profit Radar Report recommendations resulted in a 59.51% net gain in 2013.
Follow Simon on Twitter @ iSPYETF or sign up for the FREE iSPYETF Newsletter to get actionable ETF trade ideas delivered for free.

|