Lucien Hooper, a Forbes columnist back in the 1970s, devised the Dow Jones December low indicator.
According to the December low indicator, danger lies ahead when the Dow Jones (DJI: ^DJI) violates the December low in the first quarter of the New Year.
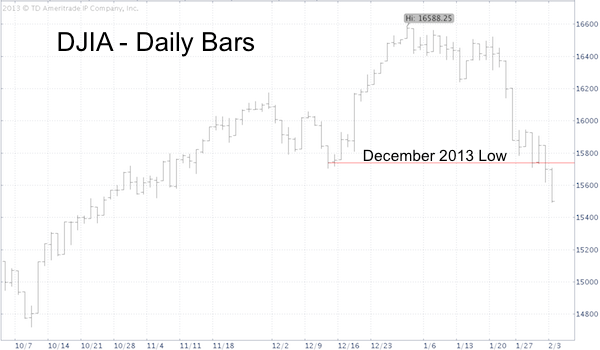
Why are we talking about this now? Because the Dow Jones and Dow Jones Diamond ETF (NYSEArca: DIA) broke below the December closing low last week (see first chart below). Is this really a bad omen?

Since 1950, there have been 31 prior first quarter December low violations.
All but two (1996 and 2006) led to further losses, averaging 10.9%.
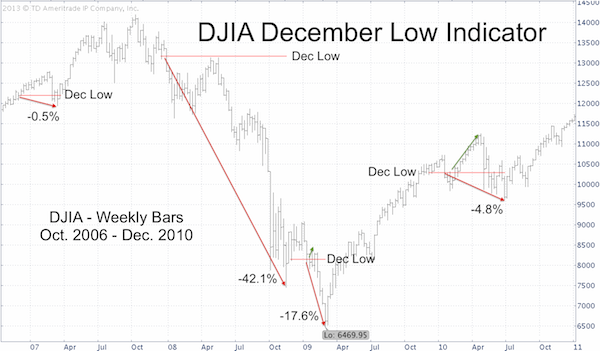
The streak of 2007, 2008, 2009, and 2010 December low violations is illustrated via the Dow Jones chart below.

The December low indicator doesn't tell us how much down side is unlocked when it's triggered, but based on the 2008 and 2009 declines it can be significant. A number of indicators suggests the 2014 down side could be significant as well (see below).

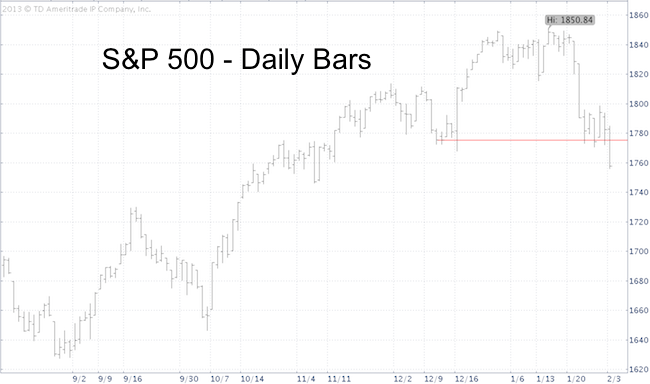
Although there is no official S&P 500 December low indicator, the S&P 500 (SNP: ^GSPC) did also slice below its December low (see S&P 500 chart below).
Unfortunately for bulls (and based on various sentiment gauges there were a ton of bulls in early January), this isn’t the only bearish development for stocks.
Three solid reasons why a longer correction is likely are disclosed here:
3 Reasons Why a Larger Correction is Likely
Simon Maierhofer is the publisher of the Profit Radar Report. The Profit Radar Report presents complex market analysis (S&P 500, Dow Jones, gold, silver, euro and bonds) in an easy format. Technical analysis, sentiment indicators, seasonal patterns and common sense are all wrapped up into two or more easy-to-read weekly updates. All Profit Radar Report recommendations resulted in a 59.51% net gain in 2013.
Follow Simon on Twitter @ iSPYETF or sign up for the FREE iSPYETF Newsletter to get actionable ETF trade ideas delivered for free.

|