It's official, the S&P 500 lost 3.6% in the first month of 2014, the Dow Jones (DJI: ^DJI) closed 5.3% lower.
According to the January Barometer (as January goes, so goes the year), that’s bad news for the entire year of 2014.
There is a lot of truth, but also a lot of misconceptions about the January Barometer (JB).
Here are the facts, and nothing but the facts, based on S&P 500 (SNP: ^GSPC) data going back to 1970.
JB Truths
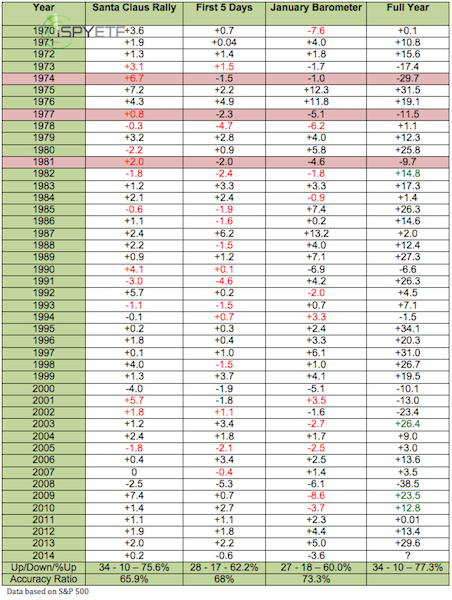
1) The JB has been correct 27 out of the last 44 years, or 73.3% of the time. As far as investment odds go, that’s pretty good.
2) In addition to the JB, I also track the Santa Claus Rally (SCR) and First 5 Days of January (F5J) indicators. In 2013/14 the SCR had a positive return, F5J and JB were down.
As the S&P 500 return table below shows (rows shaded red), there have been three such instances since 1970 (1974, 1977, 1981) when the F5J and JB were down, but the SCR up. All three early warning signals were followed by sizeable full-year losses (29.7%, 11.5%, 9.7%).

JB Myths
3) Stock Trader’s Almanac, which does a good job tracking various seasonal patterns, claims that: “Most remarkable is the record following down Januarys. Every down January on the S&P 500 since 1938, without exception, has preceded a new or extended bear market, a 10% correction, or a flat year. This is the only Stock Trader’s Almanac indicator with a perfect record.”
Let’s take a look at that ‘perfect record.’ Since 1970, there have been 17 prior down Januarys. Only eight of them were followed by full-year losses, an accuracy ratio of only 47%.
January losses in 1982, 2003, 2009, and 2010 were all followed by 10%+ corrections and full-year gains of 12.8% – 26.4%. To call this an indicator with a perfect track record doesn’t seem quite right.
It’s also possible to run the numbers based on the Dow Jones and/or go back to 1950, but the basic takeaway remains the same: Statistics suggest the S&P 500 (NYSEArca: SPY) and Dow Jones (NYSEArca: DIA) have a tough year ahead.
Statistics like this are interesting and they are a piece of the market forecasting puzzle, but they aren’t a stand-alone indicator.
Nevertheless, even if we cast a wider net, we’ll get similar feedback. Here are three more indicators and their messages:
Watch for a Bounce! But 3 Reasons Why a Larger Correction is Likely
Simon Maierhofer is the publisher of the Profit Radar Report. The Profit Radar Report presents complex market analysis (S&P 500, Dow Jones, gold, silver, euro and bonds) in an easy format. Technical analysis, sentiment indicators, seasonal patterns and common sense are all wrapped up into two or more easy-to-read weekly updates. All Profit Radar Report recommendations resulted in a 59.51% net gain in 2013.
Follow Simon on Twitter @ iSPYETF or sign up for the FREE iSPYETF Newsletter to get actionable ETF trade ideas delivered for free.

|