The December 13 article on the incredible VIX indicator drew a lot of feedback and requests for updates. Now is an appropriate time for an update.
Before we look at the actual indicator, here’s a quick nutshell summary on how this particular VIX indicator works.
The ‘incredible VIX indicator’ is a simple ratio of two short and long-term ‘fear gauges.’ We use the VIX (Chicago Options: ^VIX) and VXV.
The VIX reflects how volatile traders expect the next month to be. The VXV reflects how volatile traders expect the next three months to be.
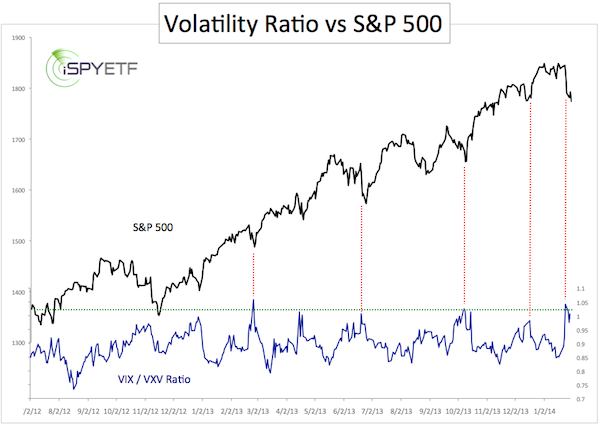
The expectation of increased short-term volatility relative to long-term volatility (VIX/VXV ratio above 1) is usually a contrarian indicator, which means short-term volatility is about to level off and the S&P 500 (NYSEArca: SPY) or other indexes are about to move higher.
The chart below plots the S&P 500 Index against the VIX/VXV ratio. Over the last four trading days the VIX/VXV ratio (based on closing prices) peaked above 1 three times.

The red lines highlight the S&P 500’s reaction to VIX/VXV ratios of 1 or higher.
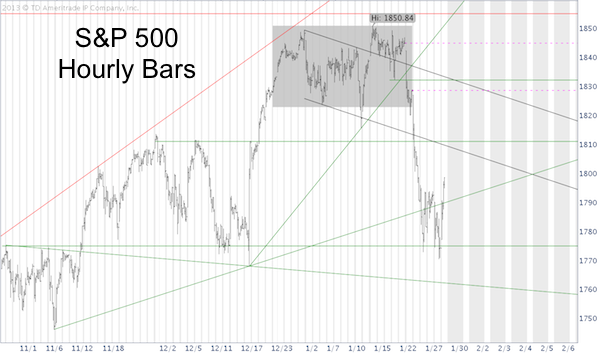
The current bounce is in harmony with the Profit Radar Reports January 27 assessment that: “A new low should still be forthcoming (perhaps around 1,760 for the S&P 500) before we see a larger bounce.”
The hourly S&P 500 chart below shows some of the trend lines and key levels we’ve been following.

Although the current bounce should move higher, the weight of evidence confirms the Profit Radar Reports 2014 Forecast, which proposed a correction starting at S&P 500 1,855. Today’s rally should have further to go, but ultimately lead to lower lows.
This article (make sure to look at the publishing date) provides more details about the S&P 500’s future path:
Watch for Bounce! But 3 Reasons Why a Larger Correction is likely
If you trade VIX vehicles like the iPath S&P 500 VIX Futures ETN (NYSEArca: VXX) or VelocityShares Daily Inverse VIX ETF (NYSEArca: TVIX), you’ll find the trading tip offered here insightful.
Record Bet: Trader Sells $18 Million in VIX Calls
Simon Maierhofer is the publisher of the Profit Radar Report. The Profit Radar Report presents complex market analysis (stocks, gold, silver, euro and bonds) in an easy format. Technical analysis, sentiment indicators, seasonal patterns and common sense are all wrapped up into two or more easy-to-read weekly updates. All Profit Radar Report recommendations resulted in a 59.51% net gain in 2013.
Follow Simon on Twitter @ iSPYETF or sign up for the FREE iSPYETF Newsletter to get actionable ETF trade ideas delivered for free.

|