The greater fool theory on Wall Street requires that the ‘dumb money’ buys from the ‘smart money’ at the top.
This implies that a ‘dumb money’ rush into stocks tends to precede some sort of down market.
Are there enough ‘great fools’ buying right now to trigger a down market, nasty correction or even flash crash?
Admittedly somewhat unwittingly (say that ten times fast) I predicted the 2010 Flash Crash using the CBOE Equity Put/Call Ratio.
The Flash Crash happened on May 6, 2010 and saw a 102-point one-day drop in the S&P 500 (SNP: ^GSPC) and 1,010-point drop in the Dow Jones (DJI: ^DJI).
In a special alert to subscribers on April 16, 2010 (now called the Profit Radar Report) I warned of the following:
“The message conveyed by the composite bullishness is unmistakably bearish. The put/call ratio in particular can have far reaching consequences. Protective put-buying provides a safety net for investors. If prices fall, the value of put options increases balancing any losses occurred by the portfolio. Put-protected positions do not have to be sold to curb losses. At current levels however, it seems that only a minority of equity positions are equipped with a put safety net. Once prices do fall and investors do get afraid of incurring losses, the only option is to sell. Selling results in more selling. This negative feedback loop usually results in rapidly falling prices.”
We are now again in an environment where the option put/call ratio has been steadily declining for weeks.
A number of media outlets have discussed the bearish message of the currently low equity put/call ratio.
As with any indicator, the current put/call ratio needs to be viewed in context with the bigger picture. The chart below does just that.
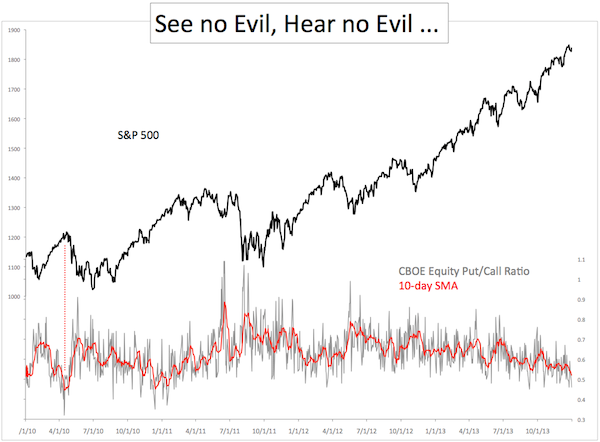
The first chart plots the S&P 500 against the CBOE Equity Put/Call Ratio (daily data and 10-day SMA). The vertical dashed red line on the left marks the Flash Crash.

Four years of daily put/call data comes with a lot of noise.
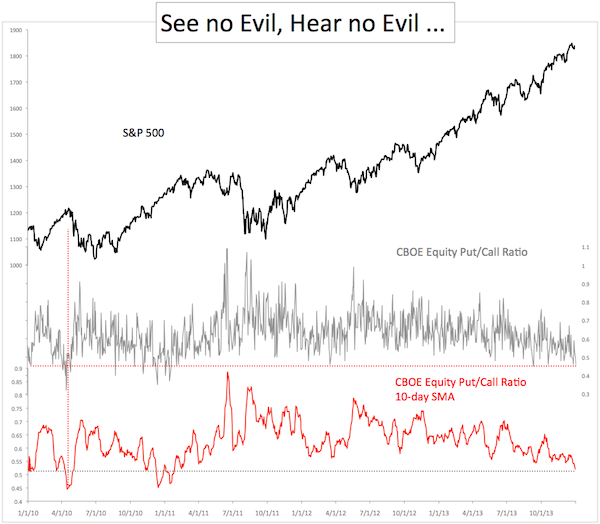
The second chart plots the S&P 500 (NYSEArca: SPY) against the same data, but filters out some of the noise by separating the daily and 10-day SMA put/call data.

The daily put/call ratio dropped to 0.46 on 12/31 and 0.47 yesterday, which means call volume was more than twice put volume. This doesn’t happen often and has lead to corrections in the past.
The 10-day SMA put/call ratio was at 0.512 on Wednesday, the lowest reading since January 2011. Back then it didn’t affect stocks immediately, in fact the market kept moving higher (albeit not in a straight line) for three more months before giving back all gains and then some.
Three weeks before the Flash Crash, the 10-day put/call SMA fell as low as 0.445.
The Flash Crash on May 6 was a result of bullish enthusiasm and lacking put protection as explained above.
Is a Flash Crash possible in early 2014? It’s possible, but unlikely.
But it doesn’t take a Flash Crash to eat into profits. A garden-variety correction can do the same thing Chinese drip torture style.
Another data point shows that ‘Mom and Pop’ are piling back into stocks, which enhances the bearish message of the put/call ratio (click here for more details: Welcome Back Mom & Pop – Ready for Another Roller Coaster Ride?).
The biggest lesson of 2013 is not to sell indiscriminately just because sentiment becomes overheated.
Throughout 2013 the Profit Radar Report continued to anticipate higher prices despite elevated sentiment levels. Only in recent weeks sentiment has reached levels indicative of increasing risk for longs.
Nevertheless, to get a sell signal in this QE market we need to see extreme bullishness (which we now have) and a drop below support. To repeat: Only bullishness AND a drop below support = Sell signal. This combination is so powerful I call it ‘insider trading.’
Here’s a look at how this kind of ‘insider trading’ works and where key support for the Dow Jones is right now. Insider Trading Just Became Legal
Simon Maierhofer is the publisher of the Profit Radar Report. The Profit Radar Report presents complex market analysis (stocks, gold, silver, euro and bonds) in an easy format. Technical analysis, sentiment indicators, seasonal patterns and common sense are all wrapped up into two or more easy-to-read weekly updates. All Profit Radar Report recommendations resulted in a 59.51% net gain in 2013.
Follow Simon on Twitter @ iSPYETF or sign up for the FREE iSPYETF Newsletter to get actionable ETF trade ideas delivered for free.

|