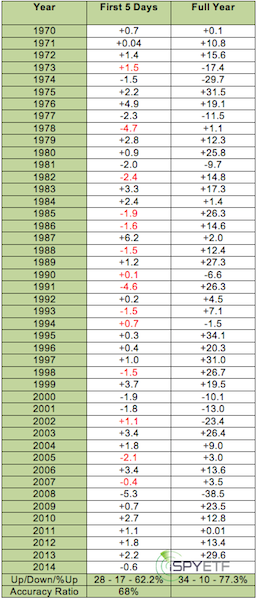
The S&P 500 (SNP: ^GSPC) lost 0.6% in the first five days of January.
Many consider this a warning signal for the entire year. Is this fact or fiction?
Since 1970, the S&P 500 recorded a loss in the first five trading days 16 times.
Out of those 16 times, the S&P 500 (NYSEArca: SPY) closed the year lower only six times, for a lousy accuracy ratio of 37.5%.

Used as a barometer (as the first 5 days of January go, so goes the year), this indicator has an accuracy ratio of 68%.
How can that be?
Since 1970, the S&P 500 has closed in positive territory 34 out of 44 years (77.3%).
The first five days of January have been up 28 out of 44 years (68% of the time).
By default, the S&P 500 (NYSEArca: SPY) has an upside bias, that’s why the first five days used as a barometer is more accurate than the predictive power of a negative first five day return.
A closer look at similar stats uncovers a major myth about the infamous Santa Claus rally (click here for details: Official Santa Claus Rally Result Surprise) and an amazing 100% full-year forecast indicator (click here for details: Waiting on What the 100% Accurate Barometer Forecasts for 2014).
Simon Maierhofer is the publisher of the Profit Radar Report. The Profit Radar Report presents complex market analysis (stocks, gold, silver, euro and bonds) in an easy format. Technical analysis, sentiment indicators, seasonal patterns and common sense are all wrapped up into two or more easy-to-read weekly updates. All Profit Radar Report recommendations resulted in a 59.51% net gain in 2013.
Follow Simon on Twitter @ iSPYETF or sign up for the FREE iSPYETF Newsletter to get actionable ETF trade ideas delivered for free.

|