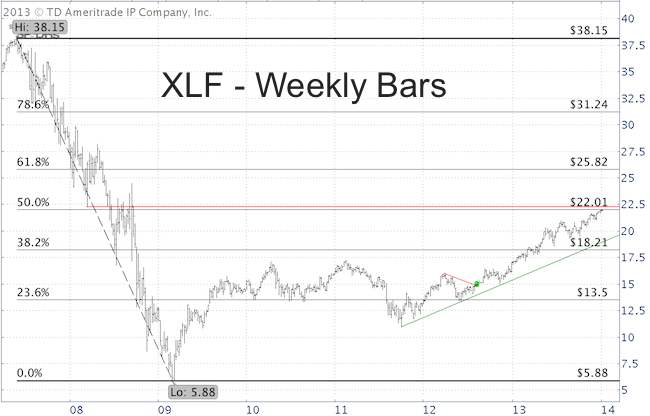
My July 12 XLF analysis stated that: “There is no real resistance until the 50% Fibonacci retracement of the points lost from May 2007 to March 2009 at 22.”
On Monday the Financial Select Sector SPDR ETF (NYSEArca: XLF) traded as high as 22.06 and reached our upside target.
The weekly XLF chart shows the 50% Fibonacci resistance along with other Fibonacci retracement support/resistance levels.
Additional resistance is provided by the March 2008 low at 22.29.

The XLF up trend is strong. In fact, thus far in 2014, XLF has already notably outperformed the S&P 500 ETF (NYSEArca: SPY).
Nevertheless, sentiment towards stocks in general and the banking/financial sector in particular is excessively bullish.
Bullish sentiment combined with strong resistance for XLF suggests that risk is rising for the financial sector.
Here is a more detailed look at overall sentiment:
Did the Strong 2013 Market Cannibalize 2014 Performance?
Simon Maierhofer is the publisher of the Profit Radar Report. The Profit Radar Report presents complex market analysis (stocks, gold, silver, euro and bonds) in an easy format. Technical analysis, sentiment indicators, seasonal patterns and common sense are all wrapped up into two or more easy-to-read weekly updates. All Profit Radar Report recommendations resulted in a 59.51% net gain in 2013.
Follow Simon on Twitter @ iSPYETF or sign up for the FREE iSPYETF Newsletter to get actionable ETF trade ideas delivered for free.

|