On December 11, I published the article titled ‘Russell 2000 Triggers Deceptive Sell Signal.’
What was deceptive about the sell signal?
The article brought out that: “The Russell 2000 just sliced convincingly below double support, but there’s reason to believe that the sell signal will be overturned soon.”
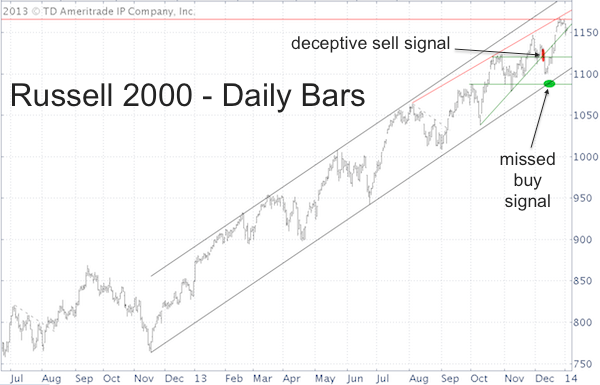
Below is an updated version of the Russell 2000 (Chicago Options: ^RUT) chart featured in the above-mentioned article.

The red oval highlights the sell signal. Strong support was located right around 1,090, which is where I expected the decline to reverse.
However, the Russell 2000 never made it to 1,090, it stopped at 1,100 and bounced strongly from there.
Although the assessment in the above-mentioned article was spot on -- “Early indicators suggest that a buying opportunity for the Russell 2000 ETF (NYSEArca: IWM), Dow Jones ETF (NYSEArca: DIA), and S&P 500 ETF (NYSEArca: SPY) might be coming up” -- the Russell 2000 didn’t drop low enough to trip our buy trigger.
The S&P 500 briefly dipped below our buy trigger (the 50-day SMA), but the Dow Jones did not.
Chasing the post-FOMC meeting spike (December 18) was somewhat dangerous, as bullish sentiment ran red hot and the upside was limited.
The next resistance for the Russell 2000 came at 1,165, where a Fibonacci projection level going back to 2002 rejected trade yesterday. Next support is at 1,120 and 1,100.
I will be using, what I call, legal 'insider information' to navigate the next few twists and turns. What I mean regarding legal insider information is explained here: 'Insider Trading' Just Became Legal'
Simon Maierhofer is the publisher of the Profit Radar Report. The Profit Radar Report presents complex market analysis (stocks, gold, silver, euro and bonds) in an easy format. Technical analysis, sentiment indicators, seasonal patterns and common sense are all wrapped up into two or more easy-to-read weekly updates. We are accountable for our work, because we track every recommendation (see track record below).
Follow Simon on Twitter @ iSPYETF or sign up for the FREE iSPYETF Newsletter to get actionable ETF trade ideas delivered for free.

|