It's official, QE3 is here. Unlike QE1 and QE2, which had a predetermined ceiling and expiration date, QE3 is open ended. The Federal Reserve pledges to buy $40 billion worth of mortgage backed securities (MBS) per month for as long as it takes.
Investors got what they wanted, so is this a big fat buy signal for the S&P 500, Dow Jones, gold, silver and all other assets under the sun?
To answer this questions we will analyse the effect of previous rounds of QE on stock (some of the details may surprise you) and compare the size of QE3 to its predecessors.
QE Like Snowflakes
Just like snowflakes, no day in the stock market and no version of QE are alike. Nevertheless, a better understanding of QE1 and QE2 may offer truly unique iinsight about QE3.
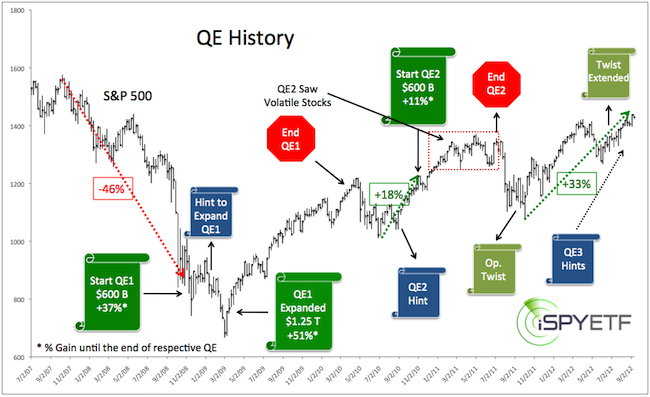
The chart below provides a detailed history of QE and Operation Twist (detailed dates are provided below).
QE1 Review
The S&P 500 (SPY) dropped 46% before the first installment of QE1 was announced (the Financial Select Sector SPDR ETF – XLF - was down 67% at the same time). By the time QE1 was expanded the S&P was trading 51% below its 2007 high.
Even without QE1 stocks were oversold and due to rally anyway (I sent out a strong buy alert on March 3 to subscribers on record). One could say that the Fed’s timing for QE1 was just perfect. The S&P rallied 37% from the first installment of QE1 (Nov. 25, 2008) and 51% from the expanded QE1 (March 18, 2009) to the end of QE1 (March 31, 2010).
QE2 Review
The S&P lost 13% from its April 2010 high to August 28, the day Bernanke dropped hints about QE2 from Jackson Hole. The S&P rallied 18% (from the July low to November 3) even before QE2 was announced.
The market was already extended when QE2 went live, but was able to tag on another 11% until QE2 ended on June 30, 2011.

QE3 Projection
Even before QE3 goes live, the S&P has already rallied 33%. Although the S&P saw a technical break out when it surpassed 1,405, the current rally is in overbought territory.
The timing for QE1 was great and the S&P rallied 37 – 51%.
The timing for QE2 was all right and the S&P rallied 11%
QE3 doesn't have an expiration date, but is limited to $40 billion a month. During QE2 the Fed spent an average of $75 billion a month on bond purchases in addition to the $22 billion of reinvested matured bonds. Operation Twist is still active, where the Fed is selling about $40 billion of short-term Treasury bonds in exchange for long-term Treasuries (related ETF: iShares Barclays 20+ year Treasury ETF - TLT).
In summary, the timing for QE3 is less than ideal, the committed amount is less than during QE1 and QE2, and QE2 has shown that stocks can decline even while the Fed keeps its fingers on the scale. QE3 may not be as great for stocks as many expect and rising oil prices may soon neutralize the "benefits" of QE3.
Detailed timeline:
November 25, 2008: QE1 announced.
Purchase of up to $100 billion in government-sponsored enterprises (GSE), up to $500 billion in mortgage-backed securities (MBS).
January 28, 2009: Ben Bernanke signals willingness to expand quantity of asset purchases.
March 18, 2009: Fed expands MBS asset purchase program to $1.25 trillion, buy up to $300 billion of longer-term Treasuries.
March 31, 2010: QE1 purchases were completed
August 26 - 28, 2010: Ben Bernanke hints at QE2
November 2 - 3, 2010: Ben Bernanke announces $600 billion QE2
June 30, 2011: QE2 ends
September 21, 2011: Operation Twist
June 20, 2012: Operation Twist extended
|