I’m just an average Joe, a largely self-taught market analyst. I don’t even try to predict what the Fed decides to do at their FOMC meetings.
I can’t read minds (especially highly encrypted Fed minds), but I can read charts (at least so I’d like to believe) and share my interpretations of ‘chart talk’ primarily via the Profit Radar Report.
Here’s what ‘yesterday’s’ charts foretold about today’s performance for the S&P 500 and Dow Jones (DJI: ^DJI).
The December 15 Profit Radar Report featured charts of the S&P 500 (SNP: ^GSPC) and Dow Jones and stated that:
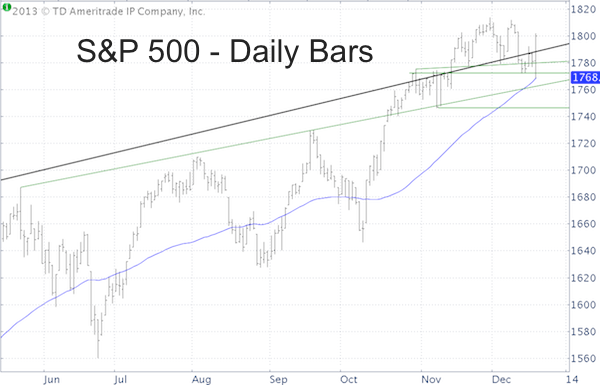
“The charts show that the support creating the ideal down side target is about 0.7 – 1% below current trade. A brief dip below the 50-day SMAs followed by a close back above would be a buy signal.”
Yesterday’s special FOMC prep Profit Radar Report summarized the expected outlook like this:
“With or without test of the 50-day SMA, odds favor overall higher prices. A move below the 50-day SMA followed by a close back above would be short-term bullish.”
A test of the 50-day SMA wasn’t absolutely necessary. Why? Because the Dow Jones and S&P 500 futures already touched their 50-day SMAs on Sunday night. (View chart and analysis here: What the S&P 500 and Dow Jones Did When You Weren’t Looking)
But, if a 50-day SMA test would happen, it would be bullish.
As the S&P 500 chart below shows, today’s post FOMC kneejerk reaction took the S&P 500 and S&P 500 ETF (NYSEArca: SPY) briefly below the 50-day SMA before soaring higher. The Dow Jones and Dow Diamond ETF (NYSEArca: DIA) did not test their 50-day SMAs.

Only 30% of Wall Street analysts expected the Fed to taper and almost everyone feared that such taper would cause a meltdown, not a melt up.
Who would have thought that a Fed taper would send stocks soaring? Charts did!
If you enjoy ‘chart talk’ from an average Joe market analyst, feel free to test drive the Profit Radar Report or click here for the most recent, free short-term forecast: S&P 500 and Dow Jones Short-term Forecast
Simon Maierhofer is the publisher of the Profit Radar Report. The Profit Radar Report presents complex market analysis (stocks, gold, silver, euro and bonds) in an easy format. Technical analysis, sentiment indicators, seasonal patterns and common sense are all wrapped up into two or more easy-to-read weekly updates. We are accountable for our work, because we track every recommendation (see track record below).
Follow Simon on Twitter @ iSPYETF or sign up for the FREE iSPYETF Newsletter to get actionable ETF trade ideas delivered for free.

|