We’ve looked at buying climaxes several times this year and every time stocks corrected shortly thereafter.
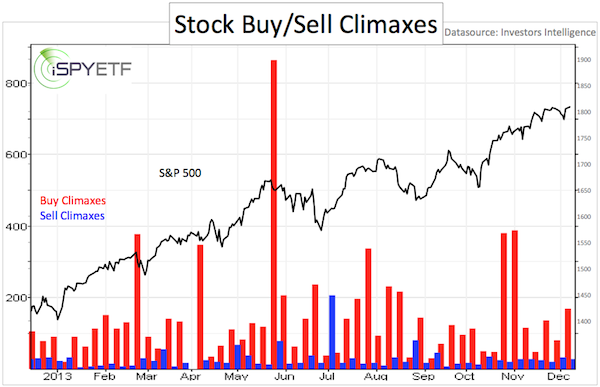
Although last week’s elevated tally of 168 buying climaxes may not have an immediate impact this time around, it carries more intrigue than previous readings, simply because they include some of Wall Street’s darlings.
Buying climaxes take place when a stock makes a 12-month high, but closes the week with a loss. They are a sign of distribution and indicate that stocks are moving from strong hands to weak ones.
Total Buy Climaxes
The chart below plots the S&P 500 (SNP: ^GSPC) against the total number of buying climaxes reported by Investors Intelligence. The universe of stocks and ETFs traded on U.S. exchanges produced 168 buying climaxes.

As the S&P 500 / buy climaxes chart shows, the current reading viewed in isolation isn’t a sell signal.
Individual Buying Climaxes
More interesting than the total climax tally are some of the individual names.
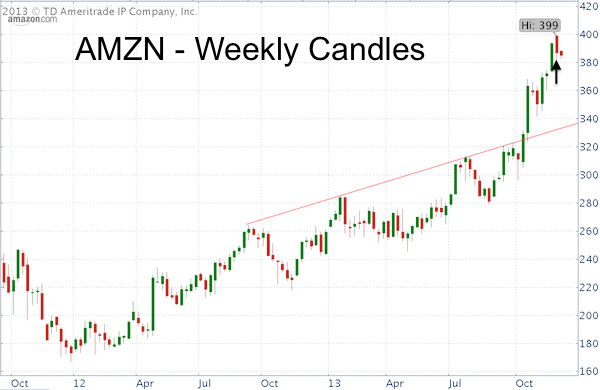
Even though t’is the season to be shopping, Amazon saw a weekly red candle (equivalent of a buying climax).
Amazon isn’t just any stock. It’s one of the prime recipients of the ‘holiday spirit,’ a recent rally leader and the third largest component of the Nasdaq-100 and Nasdaq QQQ ETF (Nasdaq: QQQ).

Visa is another casualty of last week’s buying climax report. With a weighting of 8.09%, Visa is the biggest component of the Dow Jones (NYSEArca: DIA). Visa may also be a reflection of holiday spending (who doesn’t use their credit card).
Next in line is Wal-Mart, the retail juggernaut and Dow Jones component.
Rounding up the ‘fab four buying climaxes’ is Goldman Sachs, the third biggest component of the Dow Jones (DJI: ^DJI).
Summary
Three Dow components – accounting for 18% of the entire average – produced buying climaxes last week.
Three major retailers, supposedly prime beneficiaries of holiday spending, saw weekly reversals.
Such divergences between leading stocks and the major indexes may be an indication that the stock market is fatigued and getting ready for a nap, but when?
Here is a short-term analysis of the S&P 500 and Dow Jones. S&P 500 and Dow Jones Short-term Forecast with a Twist
Simon Maierhofer is the publisher of the Profit Radar Report. The Profit Radar Report presents complex market analysis (stocks, gold, silver, euro and bonds) in an easy format. Technical analysis, sentiment indicators, seasonal patterns and common sense are all wrapped up into two or more easy-to-read weekly updates. We are accountable for our work, because we track every recommendation (see track record below).
Follow Simon on Twitter @ iSPYETF or sign up for the FREE iSPYETF Newsletter to get actionable ETF trade ideas delivered for free.

|