Is it possible to explain the Dow Jones’ slide from its recent all-time high with three letters? Yes it is. Even more, it’s actually a legitimate explanation.
On November 21 I wrote an article titled: Biggest Dow Jones Component Hits Speed Bump.
Which 3-letter company is the Dow’s biggest opponent? By now you probably guessed the answer to today’s riddle: IBM (NYSEArca: IBM).
Actually, the addition of Visa demoted IBM to the second most important stock of the Dow Jones Average (DJI: ^DJI) and the Dow Diamonds ETF (NYSEArca: DIA).
IBM accounts for 7.12% of the Dow Diamonds ETF and Dow Jones, Visa for 8.22%. Prior to the Dow Jones component reshuffle, IBM singlehandedly made up 9.43% of the Dow Jones (Chevron was a distant second with 6.22%).
So what happened to IBM?
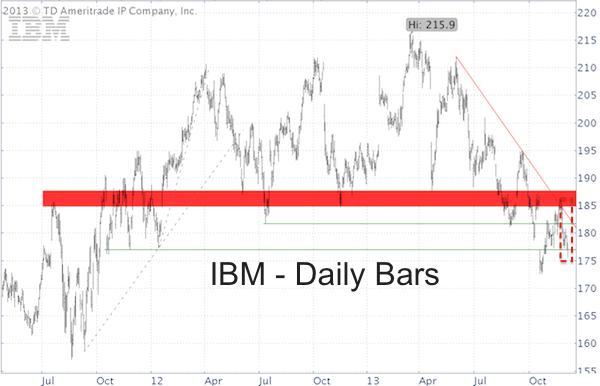
Around November 21 IBM hit major technical resistance, illustrated by the chart below. The IBM chart is an updated version of the one featured in the November 21 article (the dashed red box highlights the performance since November 21).

IBM is not the all-important Dow bellwether it used to be, but as the above-mentioned article pointed out: “When one of the major Dow components hits a speed bump, the Dow tends to suffer.”
So we’ve seen that technical resistance isn’t just financial mumbo-jumbo.
More important than resistance for IBM was the technical resistance for the Dow Jones itself.
This resistance is more road block than speed bump. A closer look at the Dow Jones resistance level is available here:
Forgot Dow 16,000 – Here’s the Real ‘Bubble Popper'
Simon Maierhofer is the publisher of the Profit Radar Report. The Profit Radar Report uses technical analysis, dozens of investor sentiment gauges, seasonal patterns and a healthy portion of common sense to spot low-risk, high probability trades (see track record below). At times Simon takes a look at major index components (such as IBM or Apple) to get a better read on the overall market.
Follow Simon on Twitter @ iSPYETF or sign up for the FREE iSPYETF Newsletter to get actionable ETF trade ideas delivered for free.

|