Every bull market has its ‘darling’ stocks. Stocks that drive the market up … and may just pull it down.
Tesla (Nasdaq: TSLA) is one of them. In fact, Tesla has almost become a cult movement.
But what goes up must come down.
I have a hard time chasing overvalued stocks (perhaps due to my frugal German heritage) and sometimes feel tempted to ‘oust’ cult stocks that just don’t deserve their price tag.
This is a dangerous game so I don’t play it often. In fact, there have only been two stocks I’ve ‘ousted’ in the last two years.
Back in September 2012 it was Apple (Nasdaq: AAPL). Via the September 12 Profit Radar Report I gave this – at the time almost sacrilege – warning and recommendation:
“Aggressive investors may short Apple or buy puts or sell calls above 700.” The rest is history.
I have only written once about Tesla in my Profit Radar Report. This was on August 31, 2013:
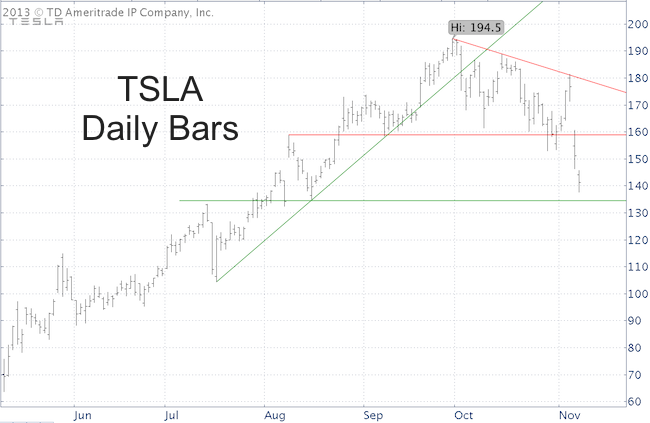
“Every once in a while I like to look at stocks that look too ‘bubbleicious’ to ignore. The current target on my radar is Tesla (TSLA). Tesla is overpriced and the business model is not as sustainable as the stock price suggests, at least in my humble opinion. Bubble stocks often move higher than expected, but when they crash it’s a sight to behold. For aggressive capital, I would consider to start buying longer-term (4 – 7 months) puts. The key is to spread out small amounts over a period of time. This is a ‘gamble trade’ for gambling money. Initial support appears to be around 158.”
On September 3 (August 31 was a Saturday) Tesla opened at 173.4. Today TSLA is around 140. More importantly, TSLA is below support at 158.

Investors today are almost as gung ho about stocks in general as they were about Tesla a couple months ago. Click here for an Analysis of Current Sentiment Extremes.
Is Tesla’s slump a harbinger for what’s next for stocks?
Tesla is a component of the Nasdaq Composite (Nasdaq: ^IXIC) and the Nasdaq-100 (Nasdaq: QQQ), so TSLA does affect the broad market, but only by a small margin.
Perhaps more importantly, Tesla’s stock may be a reflection of a shift in sentiment. Time will tell. Next support is around 135.
More important for the broad market is the fact that the S&P 500 (NYSEArca: SPY) and Nasdaq are bumping against major long-term resistance.
Failure to overcome such resistance could morph into frustration and lower prices.
Two eye-opening charts featured in this article reveal the key resistance for the S&P 500 and Nasdaq. Where is Long-term Resistance for the S&P 500 and Nasdaq?
Simon Maierhofer is the publisher of the Profit Radar Report.
Follow Simon on Twitter @ iSPYETF or sign up for the FREE Newsletter.

|