Famous investor John Templeton said that: “Bull markets are born on pessimism, grow on skepticism, mature on optimism, and die on euphoria.”
This used to be the most important rule of thumb in investing - give investors what they want. When everyone wants to own stocks, sell them yours. When everyone wants to dump stocks, buy theirs.
This rule of thumb used to work pretty reliably until an unrelenting and indiscriminate buyer entered the market place – the Federal Reserve. No matter the price, the Federal Reserve will buy it.
Templeton’s observation was based on the assumption of finite demand. The Federal Reserve has created infinite demand.
Templeton’s rule of thumb has since been replaced by John Maynard Keynes’ euphemism: “The market can stay irrational longer than you can stay solvent.”
Does that mean that investor sentiment has become obsolete as a contrarian indicator?
Has Sentiment Become Obsolete as Contrarian Indicator?
I always like to look at hard data, but truth be told there is not much hard data about sentiment extremes.
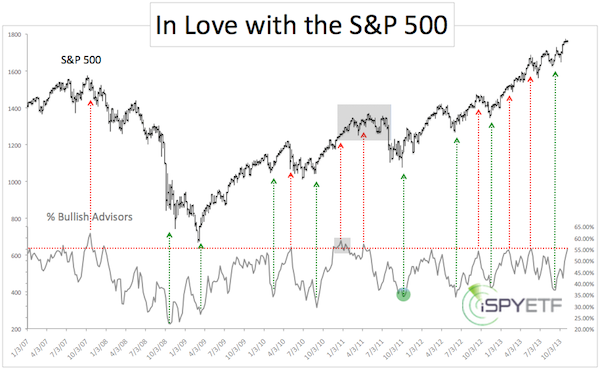
The chart below plots the S&P 500 (SNP: ^GSPC) against the percentage of bullish advisors polled by Investors Intelligence (II).

We see a nearly unprecedented wave of euphoria in late 2010. At that time many different sentiment and actual money flow gauges were literally off the charts.
Those extremes, however, had no immediate impact on stocks. In fact, the S&P 500 (NYSEArca: SPY) kept rallying for another couple months (gray boxes). Eventually the S&P 500 lost 20%.
In October 2011 investor sentiment had soured (bullish for stocks) and the S&P 500 was near important support at 1,088. In my October 4 update to subscribers (now known as the Profit Radar Report), I recommended to buy at S&P 1,088.
Since the October 2011 low the S&P 500 has rallied over 65%, but investor sentiment has never eclipsed the 2010 euphoria … until now (more below).
This rally has truly been the most hated rally in history and not a day goes by without commentary shooting against the Federal Reserve’s QE.
The worry that QE will end badly (along with political uncertainty) has provided the ‘wall of worry’ needed to propel stocks higher.
Euphoria is Back
Although we’ve seen blips of optimism, euphoria didn’t re-enter the picture until this week. Below is a discussion of various recent sentiment extremes and what they individually mean for the S&P 500 going forward:
I follow literally dozens of sentiment and actual money flow indicators. Most of them show the biggest wave of optimism since the 2010 ‘sentiment peak.’
The Most Effective Use of Sentiment Extremes
The above chart shows that excessive pessimism is a better contrarian indicator than excessive optimism.
Optimistic sentiment extremes generally translate into rising risk, but not necessarily immediate pullbacks.
That doesn’t mean we should ignore current extremes. The S&P 500 (NYSEArca: IVV) and Nasdaq Composite (Nasdaq: ^IXIC) are butting up against serious multi-year resistance right now, and disappointment over failed attempts to overcome such resistance could easily send stocks lower.
Where is this resistance and how serious is it? The two charts featured in the article “Nasdaq and S&P 500 Held Back by ‘Magic’ Resistance” pinpoint this ‘magic’ resistance level.
Simon Maierhofer is the publisher of the Profit Radar Report. The Profit Radar Report uses technical analysis, dozens of investor sentiment gauges, seasonal patterns and a healthy portion of common sense to spot low-risk, high probability trades (see track record below).
Follow Simon on Twitter @ iSPYETF or sign up for the iSPYETF Newsletter to get actionable ETF trade ideas delivered for free.

|