On Tuesday the S&P 500 (SNP: ^GSPC) rallied to new highs, on Wednesday and Thursday the S&P 500 (NYSEArca: SPY) got ‘SKEWed.’
What’s SKEWed? Is it the same as screwed? It could be.
The SKEW or SKEW Index is calculated by the Chicago Board Options Exchange (CBOE), the same exchange that publishes the VIX (Chicago Options: ^VIX).
The SKEW is an index derived from the price of the S&P 500 tail risk and attempts to quantify the odds of S&P 500 tail risk.
Like the VIX (NYSEArca: VXX), the SKEW is calculated from prices of S&P 500 out-of-the-money options. The SKEW Index basically attempts to quantify the odds of a black swan event (or S&P 500 tail risk).
CBOE identifies a black swan event as a two or more standard deviation move below the mean.
According to the CBOE, a level of 135 suggests that there’s about a 12% chance of a two-standard deviation decline within 30 days. The risk of a two-standard deviation decline drops to 6% at a reading of 115.
In simple terms, SKEW readings around 135 tend to warn of highs or tops, readings around 115 tend to go along with lows or bottoms.
Here’s where it gets interesting.
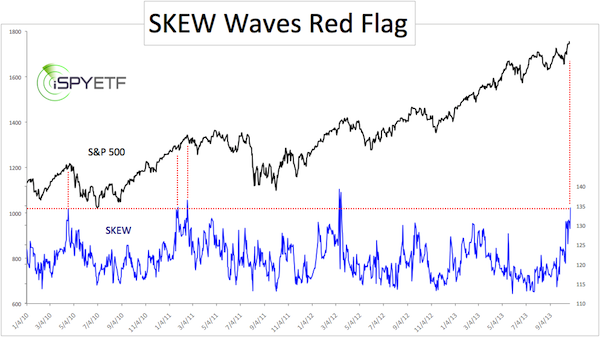
Yesterday, the SKEW Index spiked to 135.47, the highest reading since March 16, 2012. What happened in March 2012? Not much, but …
The chart below plots the S&P 500 (NYSEArca: IVV) against daily SKEW readings since 2010.

The March SKEW spike didn’t cause any immediate trouble, but starting in April stocks entered a multi-month correction.
In fact, the chart shows that future gains were always given back at some point shortly after the SKEW moved above 134.
Is the S&P 500 screwed just because it got SKEWed?
The high SKEW reading takes on additional significance as the S&P 500 also hit a long-term target and resistance level. The combination between this resistance and the SKEW may well cause trouble.
This key resistance level goes back to the origin of this rally in 2009 and is important. It is discussed in detail here: S&P 500 Hits 2009 Projection Target – Resistance or Springboard?
The Profit Radar Report monitors technical patterns, seasonality and various sentiment gauges and has been looking for S&P 1,760 as target for this rally. Now that sentiment is starting to become frothy, it’s time to become cautious.
|