In 2007 CNBC was ranked as the 19th most valuable cable channel in the U.S.
CNBC was investors go-to source for financial commentary. As many as 162,000 viewers an hour watched CNBC as technology stocks (NYSEArca: XLK) crashed and recovered in 2002.
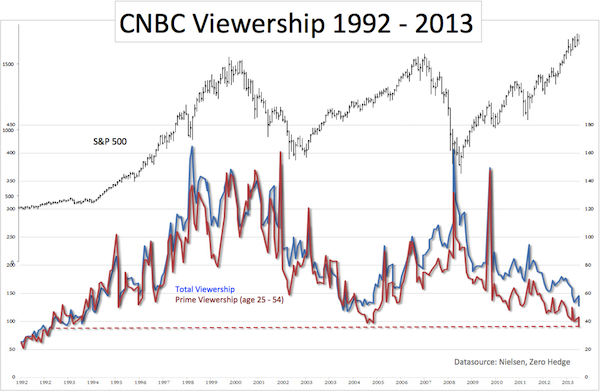
Those were literally the gold old times for CNBC. Total viewership today is only about 50,000. Even worse is the number of prime demographic viewers (age 25 – 54): 37,000 an hour, a 20-year low.
Why has CNBC lost its allure?
Is this a bullish contrarian indicator?
Record Low Viewership Explained
According to Nielsen data, the hardest hit programs are ‘Fast Money,’ ‘Mad Money,’ and ‘The Kudlow Report.’ Viewership for ‘The Kudlow Report’ was down over 50% year-over-year.
Possible reasons for disappearing viewers are: program host biases, the understanding that the stock market is rigged or complacency brought on by ever-rising prices.
Another reason, especially when looking at the data going back to the network’s inception (chart below), is the Internet.
Investors are accustomed to get their investment commentary online (like you are doing right now). CNBC is able to capture some of those viewers as about 10 million curious souls visit CNBC.com every month, up 25% year-over-year.
Is CNBC Complacency a Contrarian Indicator?
Streetinsider.com writes that ‘CNBC viewership falls as investors become complacent.’ When I hear complacent I think of the VIX (Chicago Options: ^VIX).
A high level of complacency, reflected by a low VIX (NYSEArca: VXX), has in times past (before the QE market) been dangerous for stocks.
Could CNBC viewership be a contrarian indicator like the VIX (used to be)? Here’s what the evidence shows:

The chart above plots the S&P 500 (SNP: ^GSPC) against CNBC viewership data.
Viewers turned to CNBC during certain sell offs, but there wasn’t a close enough correlation between S&P 500 (NYSEArca: SPY) tops/bottoms and CNBC viewership.
Unfortunately, we won’t be able to use this indicator as proxy for investor sentiment.
But, there are other sentiment proxies with a good track record and an astunding message. Two of them are discussed here:
Investors Remain Suspicious to a Bullish Degree
Simon Maierhofer is the publisher of the Profit Radar Report.
|