It’s said that bond (NYSEArca: AGG) investors are smarter than stock investors.
Stocks are not quite sure how to react to the budgetary/debt ceiling standoff, so we definitely can use a fair amount of ‘smarts’ right about now.
High yield bonds (or junk bonds) are the closest relative stocks have in the bond family. This is due to their elevated yield and risk levels.
So what kind of clues does the performance of high yield bonds provide for stocks?
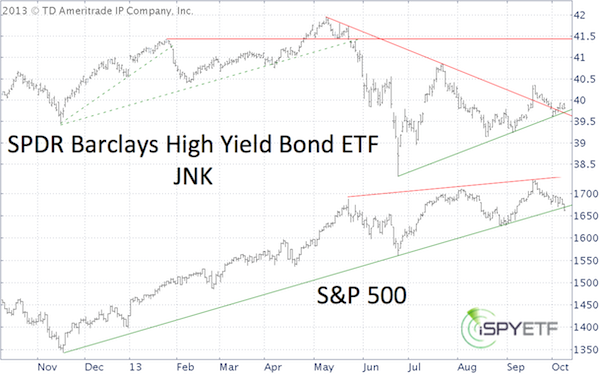
The SPDR Barclays High Yield Bond ETF (NYSEArca: JNK) chart below shows some seemingly important support/resistance levels for JNK.
The green line has provided support since June. The descending red line has offered first resistance and now support. Both lines meet today at 39.70.

The situation for the iShares iBoxx $High Yield Corporate Bond ETF (NYSEArca: HYG) looks similar, although HYG has a bit more room before it hits support around 90.70.
The above chart also plots JNK against the S&P 500 (SNP: ^GSPC) to illustrate the correlation between junk bonds and stocks.
Quite frankly, based on this chart the correlation between stocks and junk bonds looks more like a myth.
JNK trades at the same level today as in November of last year. The S&P 500 (NYSEArca: SPY) on the other hand is up 25% since November 2012.
Now the question is if further weakness for junk bonds would spell trouble for stocks?
Not necessarily, purely based on the lack of direct correlation.
However, JNK is just above support, and a case could be made that the S&P 500 is about to break out of a bearish rising wedge.
What would that mean? The implications are discussed here: Will The S&P 500 be in Trouble if Support Fails?
Simon Maierhofer is the publisher of the Profit Radar Report.
Follow Simon on Twitter @ iSPYETF or sign up for the FREE Newsletter.

|