Government shutdown here, government shutdown there, government shutdown everywhere.
Just give me the bottom line, what’s the ‘smart money’ doing? Buying or selling?
Ok, here’s the bottom line:
Commercial hedger positions in the equity futures, open interest ratios, OEX put/call ratios and last hour buyers are generally considered the smart money right now.
A closer look at the stats shows that smart money is about as neutral as can be. There is no smart money edge.
Now Who’s Dumb?
What about the ‘dumb money?’ From a contrarian perspective the ‘dumb money indicator is just as helpful as the smart money. As long as it provides an edge, it doesn’t matter if you use the smart or dumb money.
Here are a couple of contrarian indicators I regularly include in my Profit Radar Report’s monthly Sentiment Picture.
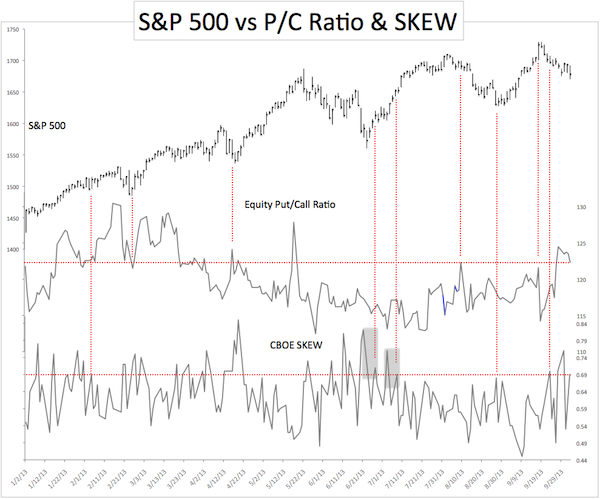
The chart below plots the S&P 500 (SNP: GSPC) against the Equity Put/Call Ratio and the SKEW Index.

The Equity Put/Call ratio measures how many calls traders are buying for every put.
The SKEW Index basically estimates the probability of a large decline. Readings of 135+ suggest a 12% chance of a large decline (2 standard deviations). Readings of 115 or less suggest a 6% chance of a large decline. In short, the higher the SKEW, the greater the risk for stocks.
The horizontal red lines mark the current reading of the Equity Put/Call Ratio and Skew. The vertical lines highlight what happened when the put/call ratio or SKEW were at reading similar to today’s.
The Equity Put/Call ratio is quite neutral. The SKEW too is in neutral territory, but there have been a couple of similar patterns (grey boxes) that led to higher prices for the S&P 500 (NYSEArca: SPY).
The VIX Signal
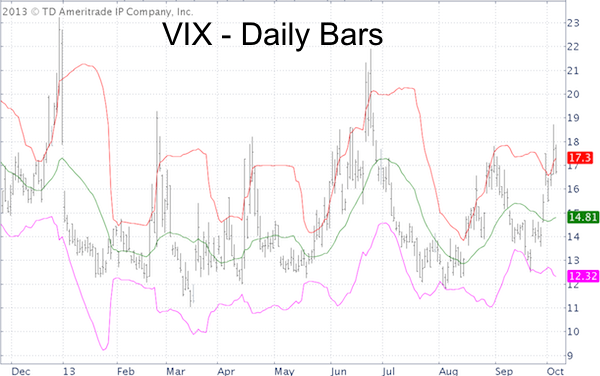
No discussion about option traders would be complete without a closer look at the VIX or CBOE Volatility Index (Chicago Options: ^VIX). Here’s a unique twist on the VIX.
The chart below shows the VIX in correlation to the Bollinger Bands. Yesterday the VIX (NYSEArca: VXX) closed above the upper Bollinger Bands, which showed that the VIX is overbought. Using this method helped me catch the October 2011 and June 2012 bottoms for subscribers to my Profit Radar Report.

Today the VIX closed below the upper Bollinger Band. I generally consider a move above and back below the upper Bollinger Band as a sell signal for the VIX (and buy signal for stocks). This constellation is actually a buy signal for the Inverse VIX ETN (NYSEArca: XIV).
However, this signal has misfired a few times lately, mainly because the Bollinger Bands were extremely compressed by the narrow VIX movement. There were times earlier this year where a 20% spike would carry the VIX from its low to above the upper Bollinger Band.
Summary
Option traders in general are pretty neutral right now. Odds slightly favor higher prices mainly based on the VIX signal. A close back above the upper Bollinger Band could be viewed as a bullish breakout for the VIX and lead to higher VIX and lower stock prices.
Fortunately, technicals (chart analysis) right now reveal a must hold support level. Higher prices are possible as long as stocks remain above support, but watch out if support fails.
The must hold support level is explained in detail here: This is Must Hold Support for the S&P 500
Simon Maierhofer is the publisher of the Profit Radar Report.
Follow Simon on Twitter @ iSPYETF or sign up for the FREE Newsletter.

|