Is the potential government shutdown a real threat to stocks or is it just a focal point that keeps investors (in particular the media) busy?
History suggests that stocks’ reaction to a shutdown is rather apathetic.
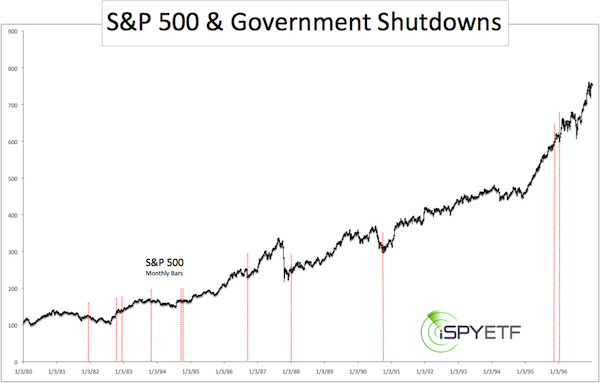
Since 1980, there have been eleven shutdowns with an average duration of 3.9 days.
The most recent one – 12/15/1995 – was the longest shutdown on record. It lasted 21 days. The other ten shutdowns between 1980 – 1995 lasted between one and five days.
The red lines on the S&P 500 (SNP: ^GSPC) chart below show all government shutdowns since 1980.

On average the S&P 500 (NYSEArca: SPY) gained 0.4% the week before the actual shutdown.
Surprisingly the S&P 500 (NYSEArca: VOO) gained 1.3% on average the week after a shutdown.
The day after the shutdown saw an average loss of 0.2%.
One Month after the shutdown the S&P 500 (NYSEArca: IVV) was positive 9 out of 11 times with an average gain of 2.5%.
We should note that all government shutdowns (going back to 1976) occurred in the fourth quarter (five started on September 30).
While October can be scary for stocks, October also has a reputation as bear market killer. The fourth quarter in general is home to various bullish seasonal forces.
Summary
History and seasonality suggest that the impact of a possible government shutdown will be shallow and short-lived.
However, 2013 is a special year. Why? Since the 1970s the S&P 500 has adhered faithfully to a 13 and 7-year cycle. Both cycles meet in 2013 and promise to exert a strong influence on stocks.
A simple chart shows just how powerful those two cycles have been. The 7 and 13-year S&P 500 cycles (along with a telling chart) are discussed in detail here: S&P 500 Cycle Analysis
Simon Maierhofer is the publisher of the Profit Radar Report.
Follow Simon on Twitter @ iSPYETF or sign up for the FREE Newsletter.

|