The right dose is important, because it’s possible to have too much of a good thing.
Take for example mold. Mold can be dangerous so we try to stay away from it. In small doses though, mold can be all right, even tasty.
If you like Gorgonzola, Blue Cheese, or Roquefort cheese you are basically eating moldy cheese that contains Roquefortine, a mold dangerous in large quantities.
Like Gorgonzola, Blue Cheese or Roquefort, Elliott Wave analysis can be healthy (for your portfolio) in controlled quantities. Like moldy cheese, Elliott Wave analysis may also be an acquired taste.
The Technical Analysis Oddball
Elliott Wave Theory (EWT or Elliott Wave analysis) is the oddball of technical indicators. Some love it, others hate it.
But investing is supposed to be about results not emotions. So regardless of emotional bias, serious investors should take an objective look at EWT.
EWT – The Good, The Bad and The Ugly
I’ve been exposed to EWT for about 10 years and have seen EWT at its best and worst. Here are the top 4 most important facts you should know about EWT:
1) EWT is interpretative. Five different Elliotticians (that’s how followers of EWT call themselves) may have 5 different interpretations of the market's current whereabouts and next move. Some Elliotticians (example below) know just enough to be dangerous, literally.
2) At certain inflection points the correct interpretation of EWT can be invaluable. It will provide insight no other form of analysis can (see example below).
3) Never use EWT as a stand-alone indicator. I always use EWT (when I use it) in combination with technical support/resistance levels, sentiment and seasonality.
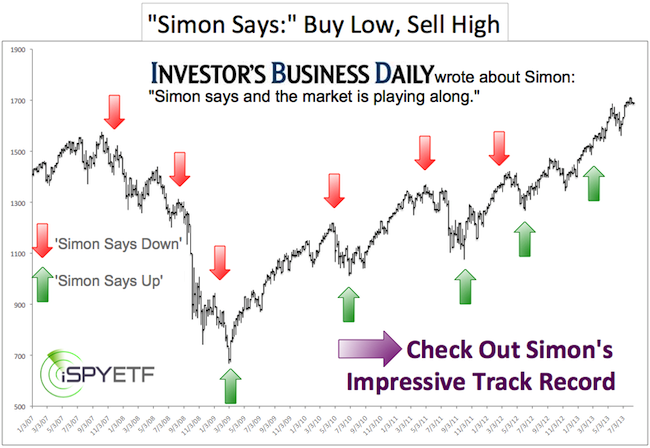
4) EWT has been effective in spotting major market bottoms (with the help of EWT I’ve been able to get my subscribers back into the market in March 2009, October 2011, and June 2012), but rather ineffective in spotting tops.
EWT – The Good
As mentioned above, there’s a time to use EWT and there’s a time to ignore EWT.
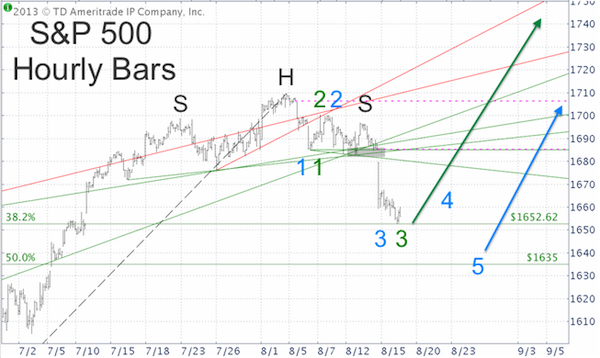
One of the more recent times I referred to EWT was via the August 18 Profit Radar Report, which featured the S&P 500 chart below. At the time, EWT strongly suggested that with or without a minor new low, stocks are gearing up for a large rally with a target at 1,685 - 1,706 (open chart gaps) or higher.
Trend lines suggested that the S&P 500 will run out of gas (at least temporarily) at 1,735 (September 18 Profit Radar Report).

Partially based on EWT, subscribers to the Profit Radar Report were advised to go long on August 29 when the S&P 500 (SNP: ^GSPC) triggered a buy signal at 1,642.
EWT – The Bad and The Ugly
EWT is largely based on crowd behavior and social mood, which in turn affects the money flow. However, in recent years the Federal Reserve decided to ‘spike’ the money flow and throw EWT a curveball.
We’ll never know how much the Fed’s easy money policy affects EWT, but we know that since late 2009 some Elliotticians have stubbornly predicted a market crash.
Among them is the world’s largest (according to their claim) independent financial market forecasting firm, Elliott Wave International (EWI). EWI’s message has been the same for years. Below are just a few of EWI's market crash calls:
August 2010: “Stocks are ready to resume the ongoing bear market. The next phase of selling should be broad-based.”
November 2011: “Short-term positive seasonal biases are now dissipating and an across-the-board decline should draw financial markets lower.”
September 2012: “The stock market’s countertrend rally from June stretched to an extreme. This weak technical condition should lead to an accelerated decline.”
July 2013: “U.S. stock indexes are in the very early stages of a multi-year decline.”
Interpretation Spoils Profits
As mentioned earlier, EWT is subject to interpretation. Just because one Elliottician’s (or company’s) interpretation is wrong doesn’t mean EWT is useless.
The last time the Profit Radar Report looked at EWT was on September 8. At the time the S&P 500 (NYSEArca: SPY) was trading at 1,655 and many Elliotticians thought that the market had topped for good.
In contrast, the Profit Radar Report (on September 8) focused attention on a bullish EWT option: “There is one (normally) rare exception that allows for new highs even after a completed 5-wave reversal. In fact, the 5-wave reversals in 2010, 2011, and 2012 all led to new highs. Bullish seasonality starting in October supports this outcome.”
Some Elliotticians are still fishing for a major market top and they may well be right.
However, the S&P 500 (NYSEArca: IVV), Dow Jones (DJI: ^DJI), and Nasdaq (Nasdaq: ^IXIC) erased their bearish divergences visible a few weeks ago and seasonality and various breadth measures suggest higher prices later on this year.
The odds of a major market top have dropped a bit, but there will no doubt be time when EWT will provide valuable clues.
Regardless of the next EWT signal, I’ll continue to evaluate the dozens of indicators that make up my forecasting dashboard and share my most valuable findings via the Profit Radar Report.
Simon Maierhofer is the publisher of the Profit Radar Report.
Follow Simon on Twitter @iSPYETF or sign up for the FREE Newsletter.

|