Why would anyone outside of the lumber business care about what lumber prices are doing?
There’s a good reason: Since 2005 lumber prices have been a rather smudge-free window into the future for real estate.
For two years we’ve used lumber prices to consistently (and correctly) point towards higher real estate prices, but that may be about to change. Why?
My research shows that lumber prices lead the real estate sector by about 14 months. Setting lumber 14-months forward and plotting it against the housing sector has been a valuable real estate forecasting tool.
Nothing in investing is perfect, but the correlation between lumber (set forward by 14 months) and the housing sector is pretty remarkable. Click here to view a chart that wonderfully illustrates the lumber/real estate correlation.
Once you’ve looked at the above-referenced chart, the chart below will make more sense.

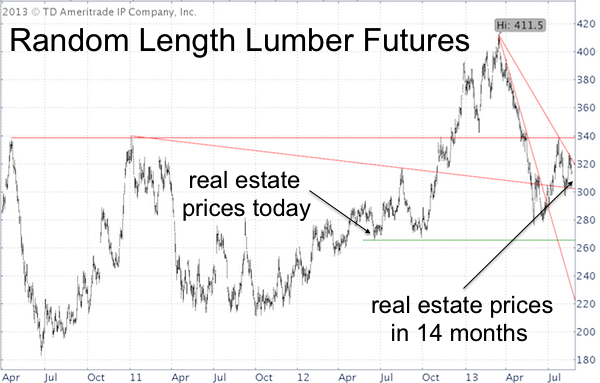
The lumber price chart below makes it clear why the housing market may be in for quite a ‘pop and drop’ kind of a ride.
From September 2012 to March 2013 lumber prices soared 53.8%, but almost all gains were given back in the next three months.
The chart begs two questions:
1) What’s next for lumber?
2) How does the housing sector react to such severe pop and drop price patterns?
This article about the lumber/real estate correlation shows exactly how real estate prices tend to react to sharp moves in lumber prices.
What’s Next for Lumber?
Our most recent lumber price analysis (July 5, 2013) highlighted the horizontal red line as target/resistance. Lumber tagged this line in late July and has been trending down since. The process of lower highs created the descending red line, which now also acts as resistance.
The path of least resistance is down as long as trade remains below the two resistance lines. A continuous drop in lumber prices would likely rattle the housing recovery along with big real estate related ETFs like:
iShares Dow Jones US Real Estate ETF (NYSEAra: IYR)
Vanguard REIT ETF (NYSEArca: VNQ)
SPDR S&P Homebuilders ETF (NYSEArca: XHB)
How Does the Housing Sector React to Severe Ups and Downs in Lumber Prices?
There have been six pop and drop performances for lumber since 2005. More often than not, it doesn’t bode well for the housing sector. This chart provides a visual of the 'pop and drop' effect on housing.
Do Lumber Prices Affect the S&P 500?

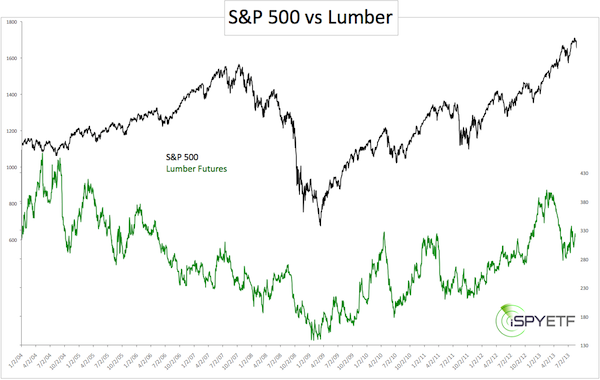
Judge for yourself. The chart below plots the S&P 500 (NYSEArca: ^GSPC) against lumber prices. There was a correlation from 2007 through mid-2011, but then the S&P 500 (NYSEArca: SPY) headed higher, lumber lower.
Lumber, as a crystal ball for stocks, would have been too much to ask for, but getting a glimpse at what may be next for real estate isn’t too shabby.
Simon Maierhofer is the publisher of the Profit Radar Report.
Follow Simon on Twitter @ iSPYETF or sign up for the FREE Newsletter.

|