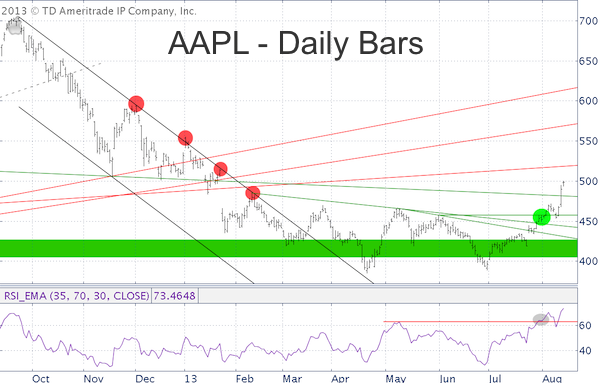
Apple (Nasdaq: AAPL) just staged the biggest rally since September’s all-time high – shares are up 28% from the June 28 low.
Will the rally stick around or deflate?
AAPL Seasonality
The other day we looked at the first ever readily available AAPL seasonality chart. It pegged the September 2012 all-time high and the onset of this rally - View AAPL seasonality chart here.
AAPL seasonality projects a minor lull and another spike before a seasonal peak in September.
AAPL Technical Analysis
The AAPL chart shows a technical breakout. This breakout happened late July (green circle) when prices busted above resistance.
Unlike prior times (red circles), AAPL wasn’t rebuffed by resistance but defied resistance.

The July 29 Profit Radar Report commented on this technical breakout and suggested that: “Investors may leg into AAPL with a stop-loss just below 447.”
This was a low-risk trade set up, as support was only a couple points below the trading price, limiting risk to a mere 0.5%.
Apple's big Tuesday spike hoisted price above another trend line, which will now serve as support.
Next resistance is around 520. As long as trade remains above support we’ll assume AAPL will get there. There are higher potential targets thereafter.
Multibillion-Dollar Tweet
The biggest concern about Tuesday’s mini Apple meltup is that it may have been caused by a news event or multibillion-dollar tweet. Via Twitter, Carl Icahn announced that he acquired a large position in AAPL.
This tweet increased Apple’s market cap by $12.5 billion. If the rally is only caused by a tweet, it could be quickly retraced. In my experience though, such external events (tweets) usually coincide with technical strength and are used to explain moves rather than causing a move.
AAPL Effect on Market
AAPL’s resurgence is happening as the overall market is showing weakness and sporting some bearish divergences.
AAPL is the biggest component of the S&P 500 (SNP: ^GSPC), Nasdaq (Nasdaq: ^IXIC), Nasdaq QQQ ETF (Nasdaq: QQQ) and Technology Select Sector SPDR (NYSEArca: XLK).
Although AAPL and broad market indexes were de-coupled from October 2012 – May 2013, Apple is still a barometer for the broad market.
Despite some cracks, the major US indexes will have a hard time declining without the participation of AAPL.
As long as the S&P 500 remains above key support, there’s little to worry about. The article – S&P 500 is Revealing Must Hold Support – shows where must hold support is located.
Simon Maierhofer is the publisher of the Profit Radar Report.
Follow him on Twitter @ iSPYETF or sign up for the FREE newsletter.

|