Investors Intelligence (II) just released the latest results of its sentiment poll. Every week II polls investment advisors and newsletter writing colleagues.
This ‘smart money bunch’ works surprisingly well as an indicator, contrarian indicator that is.
When the II crowd is excessively bullish, it’s generally time to hover around the exit. Conversely it’s usually a good time to leg into stocks when there are plenty of II bears.
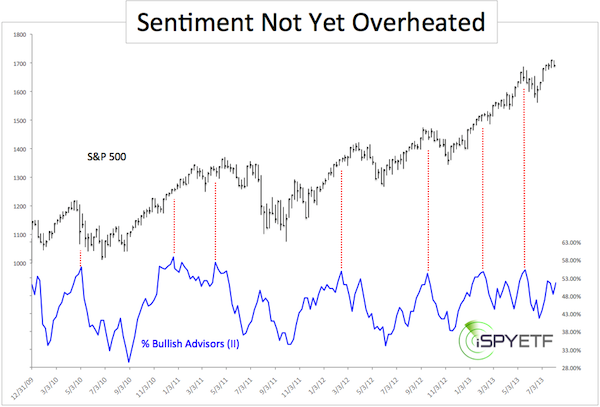
Without further ado, here are this week’s results. The chart below plots the S&P 500 (SNP: ^GSPC) against the percentage of bullish advisors polled by II.

In a nutshell, 51.6% of advisors are currently bullish. This is below this year's May 21 high of 55.2% (which foreshadowed a shallow correction).
The red lines highlight the effects prior readings above 54% had on the S&P 500 (NYSEArca: SPY). There were some great signals, but there were also some spectacular misses.
QE liquidity has certainly skewed the contrarian accuracy of this particular indicator.
The Commitment of Traders (COT) report for the S&P 500, Dow Jones Industrial (DJI: ^DJI), and Russell 2000 (Chicago Options: ^RUT) is fairly neutral.
However, commercial traders (considered the ‘smart money’) are rather bearish on the Nasdaq-100 (Nasdaq: ^IXIC) while large speculaters (the ‘not so smart money’) are predominantly bullish. COT sentiment for the Nasdaq suggests that gains may be limited.
In this QE bull market, I always take a look at a dozens of sentiment and actual money flow indicators.
What’s the message of other sentiment indicators?
I have found that sentiment surveys (such as II) combined with option traders sentiment (such as put/call ratio), and a few other off the wall (but accurate) sentiment gauges, provide a good pulse on the market.
A close look the above-mentioned indicators and their implications for stocks can be found here: "A Detailed Look at 5 Different Sentiment Gauges."
|