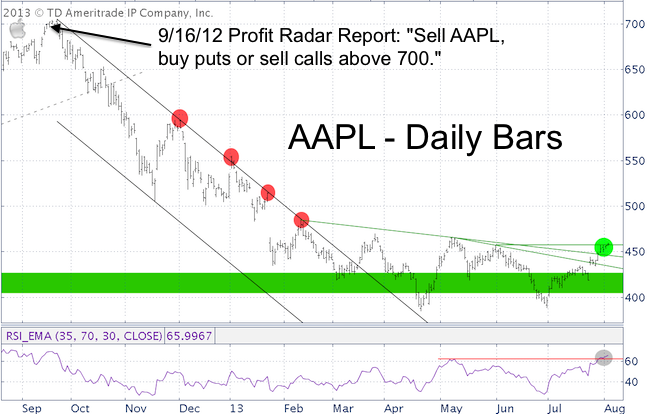
Since its September 2012 all-time high at 705, AAPL has rallied more than 10% seven times … and failed every time.
An Apple a day may keep the Doctor away, but an AAPL a day certainly hasn’t kept the bear away.
In fact, AAPL (Nasdaq: AAPL) is trading 35% below its all-time high (it was down as much as 45%). Yes, somebody really upset the apple cart (ok, that’s the last apple/AAPL pun).
Bottom line questions: Does this bounce have sticking power?
The Apple chart below compares this rally with the prior six failed rallies (gray circles). Three differences are easily noticeable:
-
Most prior rallies were unable to overcome resistance (red circle). Current trade is above two trend lines.
-
Once the high was in place, the market rolled over quickly. Current trade is lingering above support.
-
RSI is higher (although marginally) than at any other rally attempt (grey circle).

Prolonged price coiling, or consolidation, above trend line support at 447. Like a coiled up snake, AAPL may actually jump higher.
The Profit Radar Report recommended buying AAPL or AAPL calls on July 29, when AAPL traded around 447. Prices have since approached the bottom of our first upside target, so we may lock in some gains soon. Continued coverage of this specific trade is available via the Profit Radar Report.
A drop below 447, 434 and 418, on the other hand, would point to new lows.
A look at Apple seasonality (ebbs and flows created by seasonal forces) provides additional clues about Apple’s next move.
Apple seasonality is worth investigating, because it doesn’t only affect AAPL. AAPL is a major component of the Nasdaq Index (Nasdaq: ^IXIC), Nasdaq ETF (Nasdaq: QQQ), Technology Select Sector SPDR ETF (NYSEArca: XLK), and S&P 500 (SNP: ^GSPC), so the ripple effects of AAPL seasonality can draw wide circles.
“Sell in May and go away” is a well-known (and accurate in 2008, 2010, 2011, 2012) seasonal piece of wisdom usually applied to the S&P 500.
As per the Apple seasonality chart, the moniker for AAPL should be “Sell in September and go away."
AAPL seasonality chart suggested the steepest decline of the year starting on September 16. In fact, the September 16, 2012 issue of the Profit Radar Report recommended to: "short AAPL (or buy puts, or sell calls) above 700,"
Right on queue with seasonality, AAPL’s all-time high occurred on September 21.
This AAPL seasonality chart shows Apple at the cusp of the next seasonal signal.

|