Gold is special for many reasons. For example, a single ounce of gold can be stretched into a 5-mile long thread or beaten out into a 300-square foot sheet.
Gold is also non-toxic. In fact, you may find gold metal flakes in exotic foods or unusual Swiss liquor. I still have an old bottle of GoldSchlager schnapps in my bar.
This strong gold flake liquor may help drown the pain of this year’s gold performance, but other than that investors don’t care much about gold’s taste or pliability.
Investors buy gold as protection. What kind of protection? That’s a fair question. I guess unless you were looking to buy protection against making money, gold has been little more than an expensive placebo (ask John Paulson).
When central banks around the world started to quantitatively ease economies out of the ‘Great Recession,’ gold was considered an inflation hedge.
Quantitative easing (or QE) continues, but gold is trading 30% below its 2011 high.
This line of fundamental reasoning doesn’t make sense, but many investors still base their gold buying/selling decisions on a similar rationale.
Yesterday gold saw the biggest one-day spike of the year. Why? Perhaps you can make sense of this, I can’t.
“Abe’s (Shinzo Abe, Japanese Prime Minister) party and its coalition partner won a majority of upper house seats in the weekend vote, boosting his opportunities to stimulate the economy.” – San Francisco Chronicle
Nutshell explanation: More easy money will mean higher gold prices.
If plenty of easy money over the last two years coincided with the steepest gold decline in decades, why would it propel prices higher now?
Has Gold Bottomed?
To answer the question that really counts – has gold bottomed? – I rely on technical analysis.
Technical analysis is not always correct (nothing ever is), but it got us out of gold when it traded around 1,800 and to this day I receive thank you e-mails from subscribers.
(Original August 21 and 24, 2011 subscriber update: “I don’t know how much higher gold will spike but I’m pretty sure it will melt down faster than its melting up. At some point investors will have to sell holdings to pay off debt or answer margin calls. The most profitable asset is sold first. Gold has been the best performing asset for a decade and a liquidity crunch could produce sellers en masse.”)
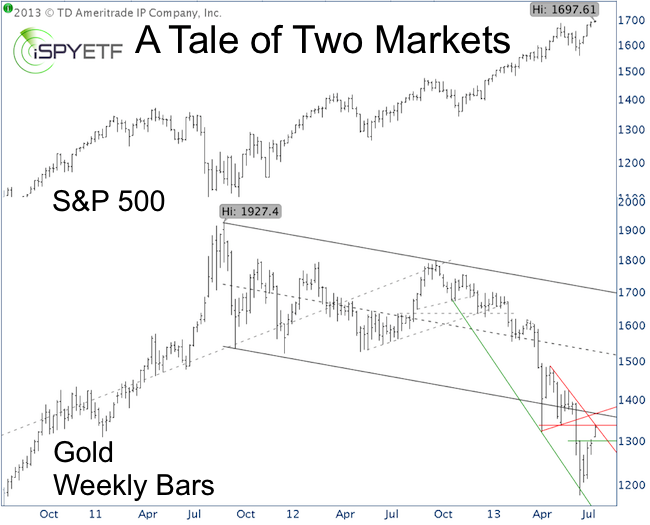
The chart below plots gold prices against the S&P 500. The resulting chart illustrates two key points:
-
The S&P 500 and gold have been moving in the opposite direction since late 2011.
-
The basic technical picture for gold.

Here’s what’s worth noting from a gold technical analysis point of view:
-
The June low occurred against green trend line support.
-
Monday’s bounce hoisted prices above resistance at 1,300.
-
Gold is bouncing against next resistance around 1,335.
After gold’s second quarter meltdown prices had to bounce. Until yesterday, it lacked the escape velocity needed to break above resistance (at 1,300), and still another move above 1,335 - 1,340 is needed to unlock higher price targets.
Since there was no bullish RSI divergence at the June low (not shown on chart), I’ve been hesitant to embrace this rally. In fact, I would prefer a new low.
But the market cares little about what I like. So, as per the July 10 Profit Radar Report, I recommended to take partial long positions in the SPDR Gold Shares (NYSEArca: GLD), or iShares Gold Trust (NYSEArca: IAU), and iShares Silver Trust (NYSEArca: SLV).
Thus far the positions have done well and we’ve locked in some profits already and increased our stop-loss to guarantee a winning trade.
Gold (and silver) will have to move higher to validate employing more capital on the long side.
|