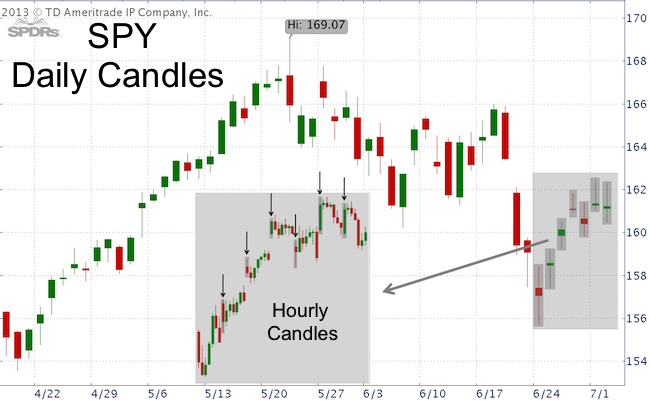
The SPDR S&P 500 ETF (SPY) has rallied as much as 4.3% from last week’s low and some analysts feel that the market has been cleared for takeoff again.
That may be the case, but the string of dojis of the recent low doesn’t inspire confidence in the longevity of this bounce.
A doji candlestick is formed when the open and close are the same or very close to equal, despite a wide trading range. They are generally an indication of equality between buyers and sellers.
The SPY chart below highlights the seven consecutive dojis since the June 24 low. The doji’s suggest that this rally is lacking the kind of buying pressure associated with lasting lows.

In fact, a closer look at the hourly chart (see gray chart insert) shows that SPY gapped higher in the first hour of trading five of the last six trading days. In other words, most of the gains occurred in the overnight futures session.
The big players may be running up the futures at night to sell their long position during the day.
While the string of dojis looks bearish for stocks, technicals are currently neutral.
I believe the overall odds favor lower prices. A well-defined resistance level for SPY, the S&P 500 and Nasdaq-100 provides a promising low-risk opportunity to go short. A break below support (also less preferred) would open a similar opportunity.
It will take sustained trade above resistance to unlock higher price targets.
The Profit Radar Report highlights the resistance level that serves as a low-risk entry for short sellers.
|