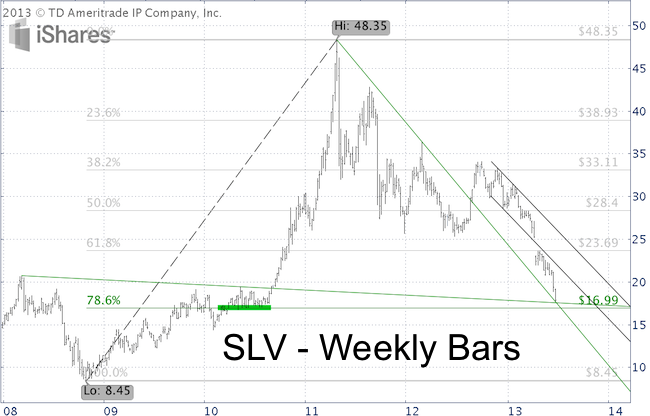
The iShares Silver Trust (SLV) is trading lower today than 5 ½ years ago and has lost 63% since its 2011 bubble high. How low can it go?
Some may still be licking their wounds from trying to catch the latest ‘falling knife,’ but it’s always an interesting challenge to see how much farther prices may go.
The chart below shows that silver prices stopped at an interesting trend line intersection today.
Double trend line support like this is known to temporarily halt declines, buoy prices and even lead to sizeable rallies.
More serious support however lies beneath Thursday’s low. The 78.6% Fibonacci retracement of the points gained from the October 2008 low to the April 2011 high is at 16.99.
General support created by a sideways basing pattern (green stripe) in 2010 is also right around 17. Normally the 17 range should be considered strong support and possible spring board for a spirited rally.

However, keep in mind we are talking about the silver ETF, not silver prices. SLV, the silver ETF, is within striking distance of its 78.6% Fibonacci Retracement support. Actual silver prices are still about 8% above its respective 78.6% Fibonacci retracement.
Which one – silver ETF or actual silver prices – will be right? Only time will tell. I base my technical analysis on actual silver prices, because it’s a truer representation of the broad market.
Regardless of your preference, one of the outlined support levels is likely to serve as a springboard for a powerful relief rally.
|