ABC News Australia reports that the Australian dollar has dipped below 94 U.S. cents for the first time in 20 months and that “some investors are anticipating the fall to continue.”
In fact, the article points out that “the number of investors making bets that the Australian dollar will fall further is at its highest since the start of 2009.”
A look at the Commitment of Traders (COT) report further enhances the ABC News report and shows that commercial traders are net long more than ever before and small speculators are net short more than ever before.
Considering that commercial traders are considered the ‘smart money’ and small speculators the ‘dumb money’ (no offense), it’s reasonable to assume that the Aussie dollar is due for a potentially significant snap back rally.
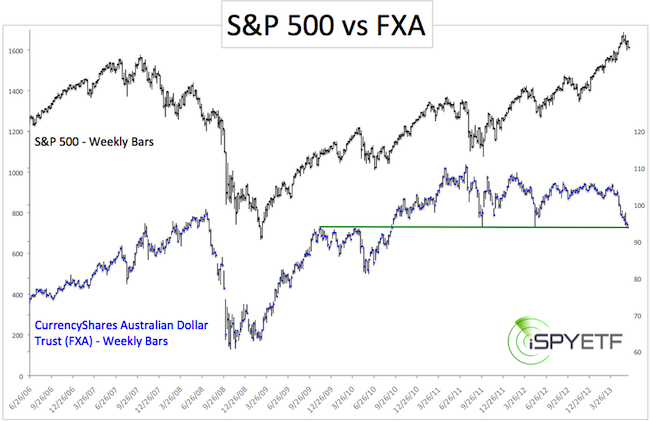
The macro analysis shows that the Aussie dollar has been behaving quite odd. Why? The first chart below, which plots the S&P 500 against the CurrencyShares Australian Dollar Trust (FXA), shows that the S&P 500 and Aussie dollar sport a high directional correlation.

Since mid-2012 however, FXA (and the Aussie dollar) has been heading south while the S&P 500 is traveling north.
While this is noteworthy, the most important feature of this chart is the green support line. It was tested in November 2007, November 2009, April 2010, October 2011 and once again now.
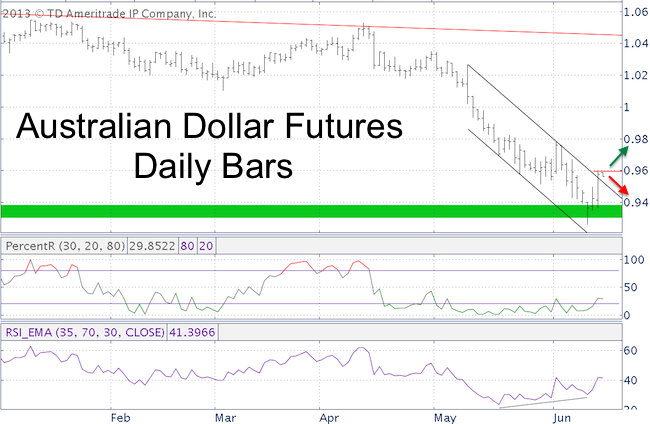
The second chart zooms in on the micro picture of the Australian dollar futures. The futures are a more pure foundation for technical analysis compared to FXA, the ETF that aims to replicate the Australian dollar. Here’s what we see:

-
The Aussie $ successfully tested the long-term support zone highlighted in the first chart.
-
The Aussie $ closed above the parallel trend channel that contained the recent decline.
-
The Aussie $ sports a bullish RSI divergence at the June 11 low.
-
The Aussie $ is just one more up day away from a failed bearish percentR low-risk entry. PercentR, as used in this scenario, attempts to highlight the most likely moment for the down trend to resume. A close above Thursday’s high suggests that the favorable window for the resumption of the down trend has passed.
It should be noted that the Aussie $ is trading heavy and that cycles currently do not support higher prices.
Summary: Sentiment towards the Aussie $ is favorable for a rise in prices. Based on technicals, the Aussie $ is one strong up day away from a sustainable breakout. A close above 96 (96.50 for FXA) will hoist it above its 20-day SMA and cause a failed bearish percentR low-risk entry. Keep a tight stop loss as cycles do not support this bounce and don't be too afraid to take profits when you get them.
>> Sign up for the FREE ETF NEWSLETTER and get the ETF SPY delivered to you.
|